
Page 278 - Sustainability in the Process Industry Integration and Optimization
P. 278
I n d u s t r i a l A p p l i c a t i o n s a n d Ca s e S t u d i e s 255
4
5
224° 366°
6 H1
60° 150.8° 366°
C 3 H2
238° 760.5 kW 293°
12 H3
52° 123° 293°
C 43 H4
481 kW
38° 54.9° 74° 207.8° 210.5° 238°
C 10 8 7 41 H5
50° 1247 kW 109° 224°
C 2 H6
108° 1235 kW 158°
42 H7
40° 104°
C H8
294.25 kW 83.3°
38° 97.17°
C 12459 kW 40 H9
38° 62.87° 68.11°
C 44 H10
3324 kW
38° 62.05° 63.11°
C C H11
1902 kW
38° 2704 kW 52.5°
C H12
38° 244.5 kW 51.5°
C H13
46° 73.9 kW 96.41°
C H14
53267 kW
38° 46°
C H15
359.6 kW 74.3° 96.3°
38° 48.92° 193°
C C 11 9 H16
563 kW
46° 653.3 kW 53°
C H17
14125 kW
38° 46°
C H18
195.83 kW
38° 46.44°
C H19
856.4 kW
38° 53°
C H20
32.3 kW
60° 67.24°
C H21
7336 kW
38° 60°
C H22
206 kW
38° 102°
C H23
1815.6 kW 88.2° 110° 134.8° 171.7°
60° 385°
C1 40 2 3 4 H 22841 kW
100° 3802 kW 2381 kW 1803 kW 4282.8 kW
C2 5 195°
58.32° 3697.5 kW 192.6°
C3 8
38° 10198.9 kW 55°
C4 10
38° 1413.6 kW 50°
C5 11
8787 kW
184.5° 872.25 kW 193°
C6 12
6
78.56° 95° 41479.7 kW 101.7°
C7 9 7
118.4° 119.3° 13291 kW
118° 4258.8 kW 213.7 kW 124°
C8 43 41 H
48.23° 1151.8 kW 2402.6 kW 49.68°
C9 44
1051.9 kW
51.16° 54.3°
C10 H
101.78° 763.9 kW
95.40° 102°
C11 42 H
5669.4 kW 200 kW
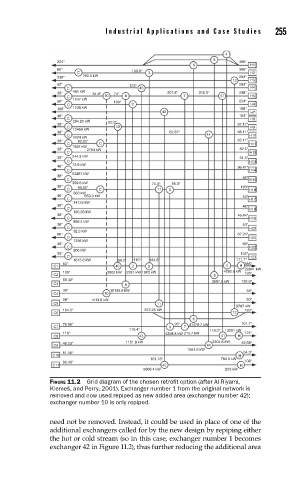
FIGURE 11.2 Grid diagram of the chosen retrofi t option (after Al Riyami,
Klemeš, and Perry, 2001). Exchanger number 1 from the original network is
removed and now used repiped as new added area (exchanger number 42);
exchanger number 10 is only repiped.
need not be removed. Instead, it could be used in place of one of the
additional exchangers called for by the new design by repiping either
the hot or cold stream (so in this case, exchanger number 1 becomes
exchanger 42 in Figure 11.2), thus further reducing the additional area