
Page 281 - Sustainability in the Process Industry Integration and Optimization
P. 281
258 C h apter Ele v e n
At all three operating points, the crude oil is preheated within a
large temperature interval—from 20°C to 310°C. The preheating
process consists of three phases. In the first phase, the crude oil is
heated from the starting temperature to its bubble point. The next
phase involves continuous partial evaporation in heat exchangers.
The third and hottest phase is heating to the specified column entry
temperature of 310°C (this heating is performed in the furnace). The
upper pump-around features a large enthalpy change split between
condensation and subcooling segments. None of the other process
streams has phase transitions.
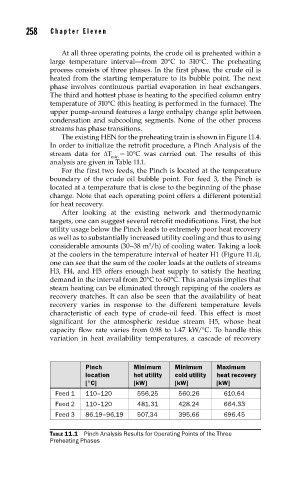
The existing HEN for the preheating train is shown in Figure 11.4.
In order to initialize the retrofit procedure, a Pinch Analysis of the
stream data for ΔT = 10°C was carried out. The results of this
min
analysis are given in Table 11.1.
For the first two feeds, the Pinch is located at the temperature
boundary of the crude oil bubble point. For feed 3, the Pinch is
located at a temperature that is close to the beginning of the phase
change. Note that each operating point offers a different potential
for heat recovery.
After looking at the existing network and thermodynamic
targets, one can suggest several retrofit modifications. First, the hot
utility usage below the Pinch leads to extremely poor heat recovery
as well as to substantially increased utility cooling and thus to using
considerable amounts (30–38 m /h) of cooling water. Taking a look
3
at the coolers in the temperature interval of heater H1 (Figure 11.4),
one can see that the sum of the cooler loads at the outlets of streams
H3, H4, and H5 offers enough heat supply to satisfy the heating
demand in the interval from 20°C to 60°C. This analysis implies that
steam heating can be eliminated through repiping of the coolers as
recovery matches. It can also be seen that the availability of heat
recovery varies in response to the different temperature levels
characteristic of each type of crude-oil feed. This effect is most
significant for the atmospheric residue stream H5, whose heat
capacity flow rate varies from 0.98 to 1.47 kW/°C. To handle this
variation in heat availability temperatures, a cascade of recovery
Pinch Minimum Minimum Maximum
location hot utility cold utility heat recovery
[°C] [kW] [kW] [kW]
Feed 1 110–120 556.25 560.26 610.64
Feed 2 110–120 481.31 428.24 664.33
Feed 3 86.19–96.19 507.34 395.66 696.45
TABLE 11.1 Pinch Analysis Results for Operating Points of the Three
Preheating Phases