
Page 277 - Sustainability in the Process Industry Integration and Optimization
P. 277
254 C h apter Ele v e n
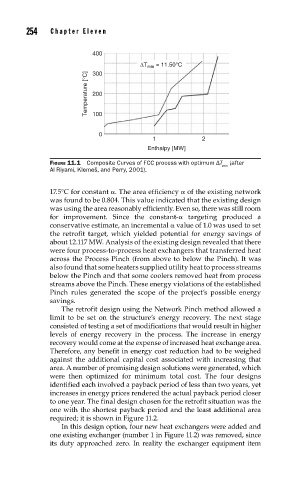
400
ΔT min = 11.50°C
300
Temperature [°C] 200
100
0
1 2
Enthalpy [MW]
FIGURE 11.1 Composite Curves of FCC process with optimum ΔT (after
min
Al Riyami, Klemeš, and Perry, 2001).
17.5°C for constant α. The area efficiency α of the existing network
was found to be 0.804. This value indicated that the existing design
was using the area reasonably efficiently. Even so, there was still room
for improvement. Since the constant-α targeting produced a
conservative estimate, an incremental α value of 1.0 was used to set
the retrofit target, which yielded potential for energy savings of
about 12.117 MW. Analysis of the existing design revealed that there
were four process-to-process heat exchangers that transferred heat
across the Process Pinch (from above to below the Pinch). It was
also found that some heaters supplied utility heat to process streams
below the Pinch and that some coolers removed heat from process
streams above the Pinch. These energy violations of the established
Pinch rules generated the scope of the project’s possible energy
savings.
The retrofit design using the Network Pinch method allowed a
limit to be set on the structure’s energy recovery. The next stage
consisted of testing a set of modifications that would result in higher
levels of energy recovery in the process. The increase in energy
recovery would come at the expense of increased heat exchange area.
Therefore, any benefit in energy cost reduction had to be weighed
against the additional capital cost associated with increasing that
area. A number of promising design solutions were generated, which
were then optimized for minimum total cost. The four designs
identified each involved a payback period of less than two years, yet
increases in energy prices rendered the actual payback period closer
to one year. The final design chosen for the retrofit situation was the
one with the shortest payback period and the least additional area
required; it is shown in Figure 11.2.
In this design option, four new heat exchangers were added and
one existing exchanger (number 1 in Figure 11.2) was removed, since
its duty approached zero. In reality the exchanger equipment item