
Page 275 - Sustainability in the Process Industry Integration and Optimization
P. 275
252 Cha p te r T e n
90 t/h 45.7 t/h 0 t/h
F.W. 100 ppm 800 ppm
20 t/h 1 20 t/h
50 t/h
100 t/h 2
20 t/h 40 t/h
40 t/h 3
20 t/h
5.7 t/h
10 t/h 4
0 t/h 44.3 t/h 45.7 t/h
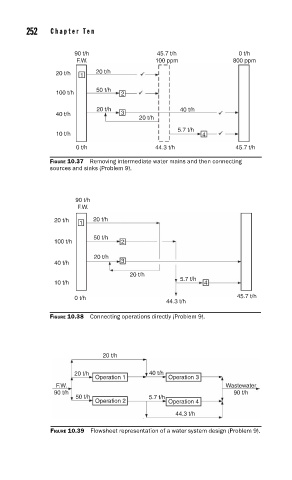
FIGURE 10.37 Removing intermediate water mains and then connecting
sources and sinks (Problem 9).
90 t/h
F.W.
20 t/h 20 t/h
1
50 t/h
100 t/h 2
20 t/h
40 t/h 3
20 t/h
5.7 t/h
10 t/h 4
0 t/h 45.7 t/h
44.3 t/h
FIGURE 10.38 Connecting operations directly (Problem 9).
20 t/h
20 t/h 40 t/h
Operation 1 Operation 3
F.W. Wastewater
90 t/h 90 t/h
50 t/h 5.7 t/h
Operation 2 Operation 4
44.3 t/h
FIGURE 10.39 Flowsheet representation of a water system design (Problem 9).