Page 274 - Sustainability in the Process Industry Integration and Optimization
P. 274

E x a m p l e s  a n d Ca s e  S t u d i e s   251


                        Flowrate        90 t/h          45.7 t/h          0 t/h
                      required for the   F.W.          100 ppm          800 ppm
                        interval
                                   20 t/h  1

                                  100 t/h        2
                         Limiting              50 ppm
                        Flowrates
                                   40 t/h        3        3
                                               50 ppm
                                   10 t/h                         4
                                                               400 ppm
                           Wastewater  (90-90)         (90-45.7)        (45.7-0)
                                        0 t/h           44.3 t/h        45.7 t/h
                                                       100 ppm          800 ppm

                                                Water mains
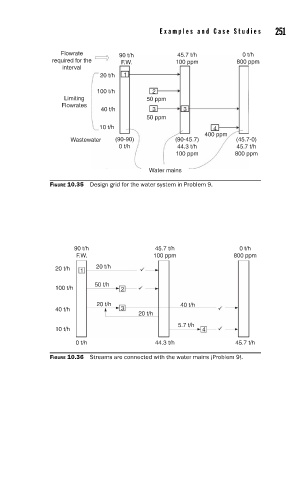
                     FIGURE 10.35  Design grid for the water system in Problem 9.


                            90 t/h                45.7 t/h               0 t/h
                            F.W.                 100 ppm               800 ppm
                       20 t/h  1  20 t/h
                                 50 t/h
                       100 t/h          2

                                  20 t/h                 40 t/h
                       40 t/h           3
                                             20 t/h
                                                        5.7 t/h
                       10 t/h                                  4
                            0 t/h                 44.3 t/h              45.7 t/h

                     FIGURE 10.36  Streams are connected with the water mains (Problem 9).
   269   270   271   272   273   274   275   276   277   278   279