Page 273 - Sustainability in the Process Industry Integration and Optimization
P. 273

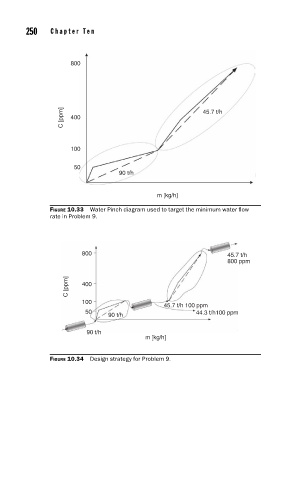
250   Cha p te r  T e n


                           800


                         C [ppm]  400                          45.7 t/h


                           100

                            50
                                        90 t/h

                                                  m [kg/h]

                     FIGURE 10.33  Water Pinch diagram used to target the minimum water fl ow
                     rate in Problem 9.


                              800                                     45.7 t/h
                                                                      800 ppm


                          C [ppm]  400


                              100
                                                    45.7 t/h 100 ppm
                               50                            44.3 t/h100 ppm
                                     90 t/h
                               90 t/h
                                               m [kg/h]

                     FIGURE 10.34  Design strategy for Problem 9.
   268   269   270   271   272   273   274   275   276   277   278