
Page 270 - Sustainability in the Process Industry Integration and Optimization
P. 270
E x a m p l e s a n d Ca s e S t u d i e s 247
10.5 Water Pinch Technology
10.5.1 Water Pinch Technology: First Problem
Problem 8: Task Assignment
A certain process contains several water-processing operations, as
shown in Table 10.22.
(a) Create the limiting CCs by plotting the contaminant concen-
tration, C, against contaminant load, m [kg/h], [ppm].
(b) Calculate the minimum water flow rate for maximum reuse.
Problem 8: Solutions
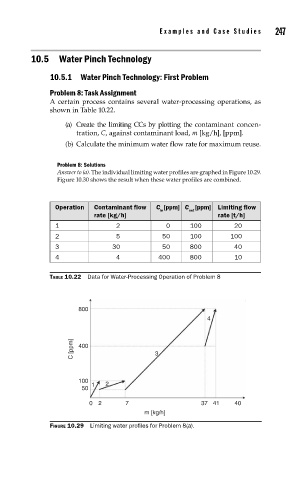
Answer to (a). The individual limiting water profiles are graphed in Figure 10.29.
Figure 10.30 shows the result when these water profiles are combined.
Operation Contaminant flow C [ppm] C [ppm] Limiting flow
in
out
rate [kg/h] rate [t/h]
1 2 0 100 20
2 5 50 100 100
3 30 50 800 40
4 4 400 800 10
TABLE 10.22 Data for Water-Processing Operation of Problem 8
800
4
C [ppm] 400 3
100 2
50 1
02 7 37 41 40
m [kg/h]
FIGURE 10.29 Limiting water profi les for Problem 8(a).