
Page 265 - Sustainability in the Process Industry Integration and Optimization
P. 265
242 Cha p te r T e n
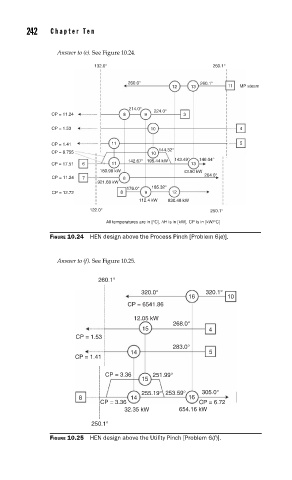
Answer to (e). See Figure 10.24.
132.0° 260.1°
260.0° 260.1°
12 13 11 MP steam
214.0° 224.0°
CP = 11.24 8 9 3
CP = 1.53 10 4
CP = 1.41 11 5
144.32°
CP = 8.755 10
142.67° 195.44 kW 143.49° 146.04°
CP = 17.51 6 11 13
180.98 kW 43.90 kW
204.0°
CP = 11.24 7 8
921.68 kW
176.0° 185.32°
CP = 12.72 8 9 12
112.4 kW 830.48 kW
122.0° 250.1°
All temperatures are in [°C], ΔH is in [kW], CP is in [kW/°C]
FIGURE 10.24 HEN design above the Process Pinch [Problem 6(e)].
Answer to (f). See Figure 10.25.
260.1°
320.0° 320.1°
16 10
CP = 6541.86
12.05 kW
268.0°
15 4
CP = 1.53
283.0°
14 5
CP = 1.41
CP = 3.36 251.99°
15
255.19° 253.59° 305.0°
8 14 16
CP = 3.36 CP = 6.72
32.35 kW 654.16 kW
250.1°
FIGURE 10.25 HEN design above the Utility Pinch [Problem 6(f)].