
Page 268 - Sustainability in the Process Industry Integration and Optimization
P. 268
E x a m p l e s a n d Ca s e S t u d i e s 245
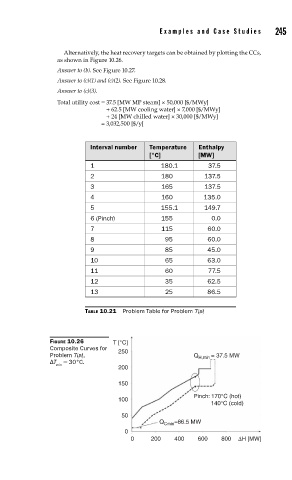
Alternatively, the heat recovery targets can be obtained by plotting the CCs,
as shown in Figure 10.26.
Answer to (b). See Figure 10.27.
Answer to (c)(1) and (c)(2). See Figure 10.28.
Answer to (c)(3).
Total utility cost = 37.5 [MW MP steam] × 50,000 [$/MWy]
+ 62.5 [MW cooling water] × 7,000 [$/MWy]
+ 24 [MW chilled water] × 30,000 [$/MWy]
= 3,032,500 [$/y]
Interval number Temperature Enthalpy
[°C] [MW]
1 180.1 37.5
2 180 137.5
3 165 137.5
4 160 135.0
5 155.1 149.7
6 (Pinch) 155 0.0
7 115 60.0
8 95 60.0
9 85 45.0
10 65 63.0
11 60 77.5
12 35 62.5
13 25 86.5
TABLE 10.21 Problem Table for Problem 7(a)
FIGURE 10.26 T [°C]
Composite Curves for
Problem 7(a), 250 Q H,min = 37.5 MW
ΔT = 30°C.
min
200
150
Pinch: 170°C (hot)
100
140°C (cold)
50
=86.5 MW
Q Cmin
0
0 200 400 600 800 ΔH [MW]