
Page 287 - Sustainability in the Process Industry Integration and Optimization
P. 287
264 C h apter Ele v e n
0.5 t/h 0.5 t/h
Packing (1)
Loss to
Loss to Process 6.265 t/h 1 t/h Environment
0 t/h
7.265 t/h Treatment Plant
(Potable) (2) Boiler Blowdown+
1.000 t/h Condensate
Lossess Neglected
26.15 t/h
Selection / Cleaning (3) 26.15 t/h
Overflow as WW 47.558 t/h 28.093 t/h Gain from Process
137.558 t/h 118.093 t/h
APV Condenser & Screen 2&3 &
Green Tank (4) Vincent Press
90.0 t/h
240.318 t/h 3.385 t/h 3.385 t/h 246.054 t/h
Vacuum Pump (5)
Waste Water
Fresh Water to
Plant 1.62 t/h 1.62 t/h from plant
Screen Taca-Taca (6)
Loss to Process 4.8 t/h
4.8 t/h
Finisher (7)
Condensate from
1.5 t/h
distiller stream
7.322 t/h Condensate from
juice vapour
Gain from Process
8.822 t/h
Distiller (8)
Loss to Process 10.95 t/h
39.6 t/h 28.65 t/h
Screen 1 (9)
Loss to Process 8.64 t/h
15.84 t/h 7.2 t/h
Distiller Condenser &
Washing Spiral 1 (10)
0.476 t/h Gain from Process
3.6 t/h 4.076 t/h
Centrifugal (11)
Total Raw Water 240.318 t/h Total Gain from Process 37.391 t/h
Total Waste Water 246.054 t/h Total Losses to Process 31.655 t/h
Difference 5.736 t/h Difference 5.736 t/h
Error % 0.00
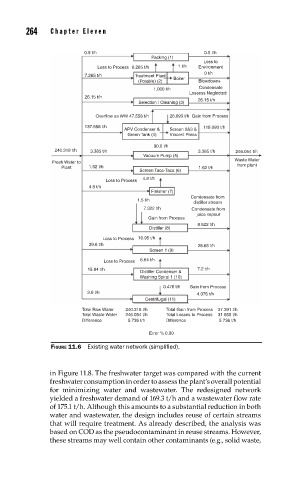
FIGURE 11.6 Existing water network (simplifi ed).
in Figure 11.8. The freshwater target was compared with the current
freshwater consumption in order to assess the plant’s overall potential
for minimizing water and wastewater. The redesigned network
yielded a freshwater demand of 169.3 t/h and a wastewater flow rate
of 175.1 t/h. Although this amounts to a substantial reduction in both
water and wastewater, the design includes reuse of certain streams
that will require treatment. As already described, the analysis was
based on COD as the pseudocontaminant in reuse streams. However,
these streams may well contain other contaminants (e.g., solid waste,