
Page 294 - Sustainability in the Process Industry Integration and Optimization
P. 294
I n d u s t r i a l A p p l i c a t i o n s a n d Ca s e S t u d i e s 271
maximized. The reduction process began at the highest level (the
highest temperature), since this utility requirement can be satisfied
at a lower cost than refrigeration at lower temperatures. The modified
system was then modeled and simulated in HYSYS, which showed a
5 percent reduction in the shaftwork required.
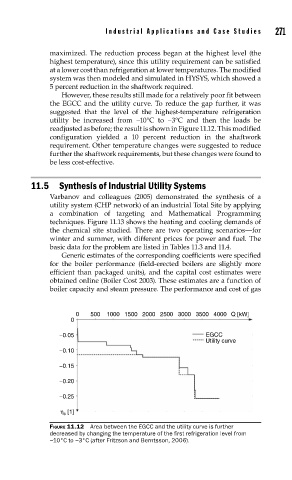
However, these results still made for a relatively poor fit between
the EGCC and the utility curve. To reduce the gap further, it was
suggested that the level of the highest-temperature refrigeration
utility be increased from −10°C to −3°C and then the loads be
readjusted as before; the result is shown in Figure 11.12. This modified
configuration yielded a 10 percent reduction in the shaftwork
requirement. Other temperature changes were suggested to reduce
further the shaftwork requirements, but these changes were found to
be less cost-effective.
11.5 Synthesis of Industrial Utility Systems
Varbanov and colleagues (2005) demonstrated the synthesis of a
utility system (CHP network) of an industrial Total Site by applying
a combination of targeting and Mathematical Programming
techniques. Figure 11.13 shows the heating and cooling demands of
the chemical site studied. There are two operating scenarios—for
winter and summer, with different prices for power and fuel. The
basic data for the problem are listed in Tables 11.3 and 11.4.
Generic estimates of the corresponding coefficients were specified
for the boiler performance (field-erected boilers are slightly more
efficient than packaged units), and the capital cost estimates were
obtained online (Boiler Cost 2003). These estimates are a function of
boiler capacity and steam pressure. The performance and cost of gas
0 500 1000 1500 2000 2500 3000 3500 4000 Q [kW]
0
−0.05 EGCC
Utility curve
−0.10
−0.15
−0.20
−0.25
η [1]
c
FIGURE 11.12 Area between the EGCC and the utility curve is further
decreased by changing the temperature of the fi rst refrigeration level from
−10°C to −3°C (after Fritzson and Berntsson, 2006).