
Page 296 - Sustainability in the Process Industry Integration and Optimization
P. 296
I n d u s t r i a l A p p l i c a t i o n s a n d Ca s e S t u d i e s 273
turbines (ranging from 11.7 to 85.4 MW) were estimated using data
from Gas Turbine World (2001).
The preliminary Total Site targets estimated minimum utility
demand of about 80 t/h for the winter scenario, leading to the choice
of a field-erected boiler for stand-alone steam generation. A gas
turbine with a Heat Recovery Steam Generator (HRSG) is also selected.
For this case, three steam mains (headers) were considered: one for
very-high-pressure (VHP) steam generated by the boiler and by the
HRSG, and two more intermediate steam mains. The VHP header
properties were specified by the problem definition and are given in
Table 11.4. Hence, locations for the two other headers still have to be
determined. Figure 11.13 illustrates the partitioning of the candidate
steam levels, whose ranges are highlighted. For the upper steam
main, this graph was used to identify three candidate levels with
respective saturation temperatures of 270.68°C, 209.15°C, and
198.89°C; the only candidate for the lower steam main there has a
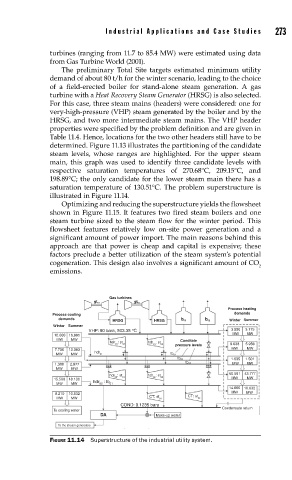
saturation temperature of 130.51°C. The problem superstructure is
illustrated in Figure 11.14.
Optimizing and reducing the superstructure yields the flowsheet
shown in Figure 11.15. It features two fired steam boilers and one
steam turbine sized to the steam flow for the winter period. This
flowsheet features relatively low on-site power generation and a
significant amount of power import. The main reasons behind this
approach are that power is cheap and capital is expensive; these
factors preclude a better utilization of the steam system’s potential
cogeneration. This design also involves a significant amount of CO
2
emissions.
Gas turbines
gt 01 gt 01
Process heating
Process cooling demands
demands b 01 b 02 Winter Summer
HRSG HRSG
Winter Summer
VHP: 90 bara, 503.35 °C 3.550 3.175
12.000 16.885 MW MW
MW MW Canditate
hdr : st hdr : st
01 01 01 02 pressure levels 9.038 5.956
MW MW
7.700 13.383 hdr
MW MW 01 tb 01
tb 02 1.635 1.501
1.300 2.877 tb 03 MW MW
MW MW
hdr : st hdr : st 50.591 43.777
15.500 18.136 hdr : tb 02 01 02 02 MW MW
MW MW 02 01
14.660 10.632
MW MW
8.210 10.632 CT: st CT: st
MW MW 01 02
COND: 0.1235 bara
Condensate return
To cooling water
DA Make-up water
To the stream generators
FIGURE 11.14 Superstructure of the industrial utility system.