
Page 295 - Sustainability in the Process Industry Integration and Optimization
P. 295
272 C h apter Ele v e n
Winter Summer
T [°C] T [°C]
300 HP level candidates 300 HP level candidates
209.15 209.15 270.68 209.15 270.68
200 200
198.89 198.89
130.51 100 130.51 LP level candidates 130.51 100 130.51 LP level candidates
−40 −20 0 20 40 60 80 −60 −40 −20 0 20 40 60 80
ΔH [MW] ΔH [MW]
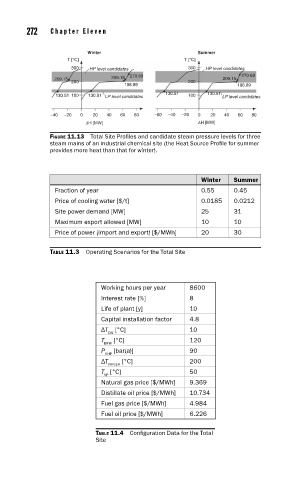
FIGURE 11.13 Total Site Profi les and candidate steam pressure levels for three
steam mains of an industrial chemical site (the Heat Source Profi le for summer
provides more heat than that for winter).
Winter Summer
Fraction of year 0.55 0.45
Price of cooling water [$/t] 0.0185 0.0212
Site power demand [MW] 25 31
Maximum export allowed [MW] 10 10
Price of power (import and export) [$/MWh] 20 30
TABLE 11.3 Operating Scenarios for the Total Site
Working hours per year 8600
Interest rate [%] 8
Life of plant [y] 10
Capital installation factor 4.8
ΔT [°C] 10
CW
T [°C] 120
BFW
P [bar(a)] 90
VHP
ΔT [°C] 200
VHP,SH
T [°C] 50
VP
Natural gas price [$/MWh] 9.369
Distillate oil price [$/MWh] 10.734
Fuel gas price [$/MWh] 4.984
Fuel oil price [$/MWh] 6.226
TABLE 11.4 Confi guration Data for the Total
Site