
Page 299 - Sustainability in the Process Industry Integration and Optimization
P. 299
276 C h apter Ele v e n
Stream Name T supply T target DH CP
[°C] [°C] [kW] [kW/°C]
1 Hot Soapy water 85 40 23.70 0.53
2 Hot Condensed 80 40 96.32 2.41
steam
3 Cold Laundry 25 55 17.60 0.59
sanitary water
4 Cold Laundry 55 85 77.27 2.58
5 Cold Boiler feed 30 60 7.13 0.24
water
6 Cold Sanitary water 25 60 77.12 2.20
7 Cold Sterilization 30 121 12.50 0.14
8 Cold Swimming pool 25 28 151.67 50.56
water
9 Cold Cooking 30 100 59.63 0.85
10 Cold Heating 18 25 100.82 14.40
11 Cold Bedpan 21 121 4.94 0.05
washers
TABLE 11.6 Process Stream Data of Hospital Complex (Herrera, Islas, and
Arriola, 2003)
T [°C]
120 Hot CC
Cold CC
100
80
60
40
PINCH
20
0 80 160 240 320 400 480
ΔH [MW]
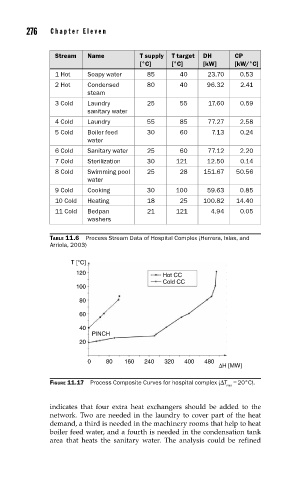
FIGURE 11.17 Process Composite Curves for hospital complex (∆T = 20°C).
min
indicates that four extra heat exchangers should be added to the
network. Two are needed in the laundry to cover part of the heat
demand, a third is needed in the machinery rooms that help to heat
boiler feed water, and a fourth is needed in the condensation tank
area that heats the sanitary water. The analysis could be refined