
Page 72 - Sustainability in the Process Industry Integration and Optimization
P. 72
P r o c e s s I n t e g r a t i o n f o r I m p r ov i n g E n e r g y E f f i c i e n c y 49
demand is referred to as a cold stream and, conversely, each
cooling demand as a hot stream.
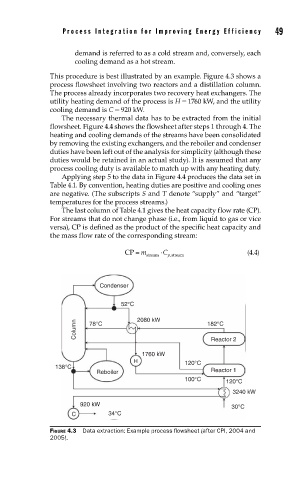
This procedure is best illustrated by an example. Figure 4.3 shows a
process flowsheet involving two reactors and a distillation column.
The process already incorporates two recovery heat exchangers. The
utility heating demand of the process is H = 1760 kW, and the utility
cooling demand is C = 920 kW.
The necessary thermal data has to be extracted from the initial
flowsheet. Figure 4.4 shows the flowsheet after steps 1 through 4. The
heating and cooling demands of the streams have been consolidated
by removing the existing exchangers, and the reboiler and condenser
duties have been left out of the analysis for simplicity (although these
duties would be retained in an actual study). It is assumed that any
process cooling duty is available to match up with any heating duty.
Applying step 5 to the data in Figure 4.4 produces the data set in
Table 4.1. By convention, heating duties are positive and cooling ones
are negative. (The subscripts S and T denote “supply” and “target”
temperatures for the process streams.)
The last column of Table 4.1 gives the heat capacity flow rate (CP).
For streams that do not change phase (i.e., from liquid to gas or vice
versa), CP is defined as the product of the specific heat capacity and
the mass flow rate of the corresponding stream:
CP m C (4.4)
stream p ,stream
Condenser
52°C
Column 78°C 2080 kW 182°C
Reactor 2
1760 kW
H 120°C
138°C
Reboiler Reactor 1
100°C
120°C
3240 kW
920 kW 30°C
C 34°C
FIGURE 4.3 Data extraction: Example process fl owsheet (after CPI, 2004 and
2005).