
Page 75 - Sustainability in the Process Industry Integration and Optimization
P. 75
52 Cha p te r F o u r
temperature-enthalpy (T-H) profile, representing the overall heat
availability in the process (the HCC) and the overall heat demands
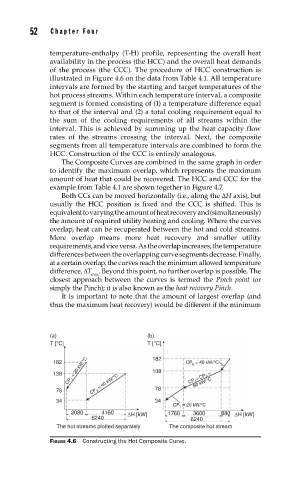
of the process (the CCC). The procedure of HCC construction is
illustrated in Figure 4.6 on the data from Table 4.1. All temperature
intervals are formed by the starting and target temperatures of the
hot process streams. Within each temperature interval, a composite
segment is formed consisting of (1) a temperature difference equal
to that of the interval and (2) a total cooling requirement equal to
the sum of the cooling requirements of all streams within the
interval. This is achieved by summing up the heat capacity flow
rates of the streams crossing the interval. Next, the composite
segments from all temperature intervals are combined to form the
HCC. Construction of the CCC is entirely analogous.
The Composite Curves are combined in the same graph in order
to identify the maximum overlap, which represents the maximum
amount of heat that could be recovered. The HCC and CCC for the
example from Table 4.1 are shown together in Figure 4.7.
Both CCs can be moved horizontally (i.e., along the ΔH axis), but
usually the HCC position is fixed and the CCC is shifted. This is
equivalent to varying the amount of heat recovery and (simultaneously)
the amount of required utility heating and cooling. Where the curves
overlap, heat can be recuperated between the hot and cold streams.
More overlap means more heat recovery and smaller utility
requirements, and vice versa. As the overlap increases, the temperature
differences between the overlapping curve segments decrease. Finally,
at a certain overlap, the curves reach the minimum allowed temperature
difference, ΔT . Beyond this point, no further overlap is possible. The
min
closest approach between the curves is termed the Pinch point (or
simply the Pinch); it is also known as the heat recovery Pinch.
It is important to note that the amount of largest overlap (and
thus the maximum heat recovery) would be different if the minimum
(a) (b)
T [°C] T [°C]
CP 1 = 20 kW/°C 138
182 182 CP 2 = 40 kW/°C
138 CP 1 + CP 2 =
78 CP 2 = 40 kW/°C 78 60 kW/°C
34 34
CP 1 = 20 kW/°C
2080 4160 ΔH [kW] 1760 3600 880 ΔH [kW]
6240 6240
The hot streams plotted separately The composite hot stream
FIGURE 4.6 Constructing the Hot Composite Curve.