
Page 57 - Materials Chemistry, Second Edition
P. 57
Ch002-P373623.qxd 3/22/07 5:27 PM Page 38
Sustainable Industrial Design and Waste Management
38
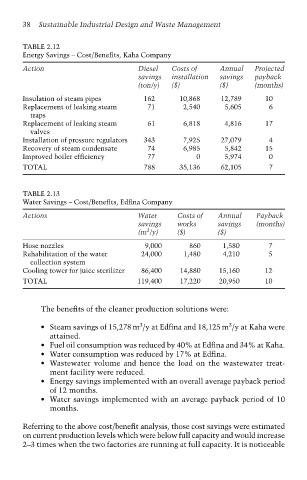
TABLE 2.12
Energy Savings – Cost/Benefits, Kaha Company
Action Diesel Costs of Annual Projected
savings installation savings payback
(ton/y) ($) ($) (months)
Insulation of steam pipes 162 10,868 12,789 10
Replacement of leaking steam 71 2,540 5,605 6
traps
Replacement of leaking steam 61 6,818 4,816 17
valves
Installation of pressure regulators 343 7,925 27,079 4
Recovery of steam condensate 74 6,985 5,842 15
Improved boiler efficiency 77 0 5,974 0
TOTAL 788 35,136 62,105 7
TABLE 2.13
Water Savings – Cost/Benefits, Edfina Company
Actions Water Costs of Annual Payback
savings works savings (months)
3
(m /y) ($) ($)
Hose nozzles 9,000 860 1,580 7
Rehabilitation of the water 24,000 1,480 4,210 5
collection system
Cooling tower for juice sterilizer 86,400 14,880 15,160 12
TOTAL 119,400 17,220 20,950 10
The benefits of the cleaner production solutions were:
3
3
• Steam savings of 15,278 m /y at Edfina and 18,125 m /y at Kaha were
attained.
• Fuel oil consumption was reduced by 40% at Edfina and 34% at Kaha.
• Water consumption was reduced by 17% at Edfina.
• Wastewater volume and hence the load on the wastewater treat-
ment facility were reduced.
• Energy savings implemented with an overall average payback period
of 12 months.
• Water savings implemented with an average payback period of 10
months.
Referring to the above cost/benefit analysis, those cost savings were estimated
on current production levels which were below full capacity and would increase
2–3 times when the two factories are running at full capacity. It is noticeable