Page 86 - Materials Chemistry, Second Edition
P. 86

Ch002-P373623.qxd  3/22/07  5:27 PM  Page 67
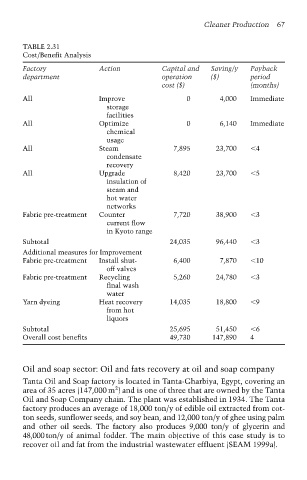
                TABLE 2.31                                      Cleaner Production  67
                Cost/Benefit Analysis

                Factory             Action           Capital and  Saving/y   Payback
                department                           operation    ($)        period
                                                     cost ($)                (months)
                All                 Improve                 0        4,000   Immediate
                                      storage
                                      facilities
                All                 Optimize                0        6,140   Immediate
                                      chemical
                                      usage
                All                 Steam               7,895       23,700    4
                                      condensate
                                      recovery
                All                 Upgrade             8,420       23,700    5
                                      insulation of
                                      steam and
                                      hot water
                                      networks
                Fabric pre-treatment  Counter           7,720       38,900    3
                                      current flow
                                      in Kyoto range
                Subtotal                               24,035       96,440    3
                Additional measures for Improvement
                Fabric pre-treatment  Install shut-     6,400        7,870    10
                                      off valves
                Fabric pre-treatment  Recycling         5,260       24,780    3
                                      final wash
                                      water
                Yarn dyeing         Heat recovery      14,035       18,800    9
                                      from hot
                                      liquors
                Subtotal                               25,695       51,450    6
                Overall cost benefits                   49,730      147,890   4


                Oil and soap sector: Oil and fats recovery at oil and soap company
                Tanta Oil and Soap factory is located in Tanta-Gharbiya, Egypt, covering an
                                         2
                area of 35 acres (147,000 m ) and is one of three that are owned by the Tanta
                Oil and Soap Company chain. The plant was established in 1934. The Tanta
                factory produces an average of 18,000 ton/y of edible oil extracted from cot-
                ton seeds, sunflower seeds, and soy bean, and 12,000 ton/y of ghee using palm
                and  other oil seeds. The factory also produces 9,000 ton/y of glycerin and
                48,000ton/y of animal fodder. The main objective of this case study is to
                recover oil and fat from the industrial wastewater effluent (SEAM 1999a).
   81   82   83   84   85   86   87   88   89   90   91