Page 100 -
P. 100

ChaPter 3  •  ProjeCt management     67

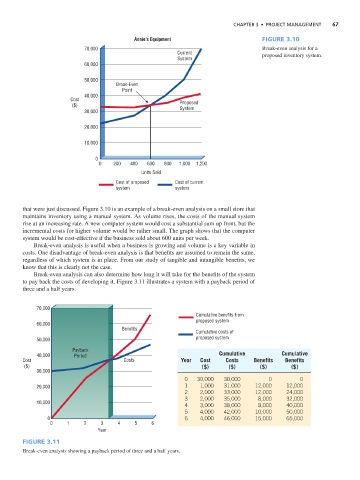
                                                      Annie’s Equipment                         Figure 3.10
                                      70,000                                                    Break-even analysis for a
                                                                    Current                     proposed inventory system.
                                                                    System
                                      60,000


                                      50,000
                                                Break-Even
                                                  Point
                                      40,000
                                 Cost
                                  ($)                                Proposed
                                                                     System
                                      30,000
                                      20,000


                                      10,000

                                         0
                                          0    200   400  600   800  1,000  1,200
                                                        Units Sold
                                                Cost of proposed    Cost of current
                                                system              system


                 that were just discussed. Figure 3.10 is an example of a break-even analysis on a small store that
                 maintains inventory using a manual system. As volume rises, the costs of the manual system
                 rise at an increasing rate. A new computer system would cost a substantial sum up front, but the
                 incremental costs for higher volume would be rather small. The graph shows that the computer
                 system would be cost-effective if the business sold about 600 units per week.
                     Break-even analysis is useful when a business is growing and volume is a key variable in
                 costs. One disadvantage of break-even analysis is that benefits are assumed to remain the same,
                 regardless of which system is in place. From our study of tangible and intangible benefits, we
                 know that this is clearly not the case.
                     Break-even analysis can also determine how long it will take for the benefits of the system
                 to pay back the costs of developing it. Figure 3.11 illustrates a system with a payback period of
                 three and a half years.


                      70,000
                                                                           Cumulative benefits from
                                                                           proposed system
                      60,000
                                                  Benefits
                                                                           Cumulative costs of
                      50,000                                               proposed system
                                  Payback
                      40,000      Period                                          Cumulative           Cumulative
                 Cost                              Costs              Year  Cost    Costs     Benefits  Benefits
                  ($)                                                       ($)      ($)        ($)       ($)
                      30,000
                                                                       0   30,000   30,000         0         0
                      20,000                                           1    1,000   31,000    12,000    12,000
                                                                       2    2,000   33,000    12,000    24,000
                                                                       3    2,000   35,000     8,000    32,000
                      10,000
                                                                       4    3,000   38,000     8,000    40,000
                                                                       5    4,000   42,000    10,000    50,000
                         0                                             6    4,000   46,000    15,000    65,000
                          0     1    2     3     4    5     6
                                          Year
                 Figure 3.11
                 Break-even analysis showing a payback period of three and a half years.
   95   96   97   98   99   100   101   102   103   104   105