
Page 107 -
P. 107
74 Part 1 • SyStemS analySiS FundamentalS
Figure 3.18 Activity
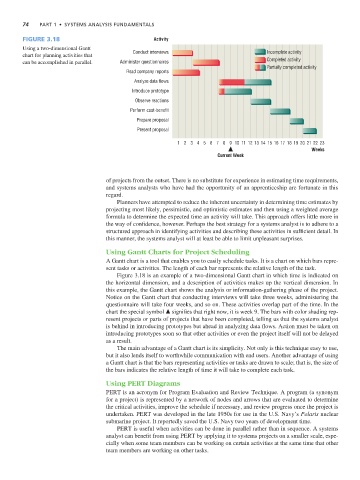
Using a two-dimensional Gantt
chart for planning activities that Conduct interviews Incomplete activity
can be accomplished in parallel. Administer questionnaires Completed activity
Partially completed activity
Read company reports
Analyze data flows
Introduce prototype
Observe reactions
Perform cost-benefit
Prepare proposal
Present proposal
1 2 3 4 5 6 7 8 9 10 11 12 13 14 15 16 17 18 19 20 21 22 23
Weeks
Current Week
of projects from the outset. There is no substitute for experience in estimating time requirements,
and systems analysts who have had the opportunity of an apprenticeship are fortunate in this
regard.
Planners have attempted to reduce the inherent uncertainty in determining time estimates by
projecting most likely, pessimistic, and optimistic estimates and then using a weighted average
formula to determine the expected time an activity will take. This approach offers little more in
the way of confidence, however. Perhaps the best strategy for a systems analyst is to adhere to a
structured approach in identifying activities and describing these activities in sufficient detail. In
this manner, the systems analyst will at least be able to limit unpleasant surprises.
Using Gantt Charts for Project Scheduling
A Gantt chart is a tool that enables you to easily schedule tasks. It is a chart on which bars repre-
sent tasks or activities. The length of each bar represents the relative length of the task.
Figure 3.18 is an example of a two-dimensional Gantt chart in which time is indicated on
the horizontal dimension, and a description of activities makes up the vertical dimension. In
this example, the Gantt chart shows the analysis or information-gathering phase of the project.
Notice on the Gantt chart that conducting interviews will take three weeks, administering the
questionnaire will take four weeks, and so on. These activities overlap part of the time. In the
chart the special symbol m signifies that right now, it is week 9. The bars with color shading rep-
resent projects or parts of projects that have been completed, telling us that the systems analyst
is behind in introducing prototypes but ahead in analyzing data flows. Action must be taken on
introducing prototypes soon so that other activities or even the project itself will not be delayed
as a result.
The main advantage of a Gantt chart is its simplicity. Not only is this technique easy to use,
but it also lends itself to worthwhile communication with end users. Another advantage of using
a Gantt chart is that the bars representing activities or tasks are drawn to scale; that is, the size of
the bars indicates the relative length of time it will take to complete each task.
Using PERT Diagrams
PERT is an acronym for Program Evaluation and Review Technique. A program (a synonym
for a project) is represented by a network of nodes and arrows that are evaluated to determine
the critical activities, improve the schedule if necessary, and review progress once the project is
undertaken. PERT was developed in the late 1950s for use in the U.S. Navy’s Polaris nuclear
submarine project. It reportedly saved the U.S. Navy two years of development time.
PERT is useful when activities can be done in parallel rather than in sequence. A systems
analyst can benefit from using PERT by applying it to systems projects on a smaller scale, espe-
cially when some team members can be working on certain activities at the same time that other
team members are working on other tasks.