Page 109 -
P. 109

76     Part 1  •  SyStemS analySiS FundamentalS

              Figure 3.20
                                                                          20
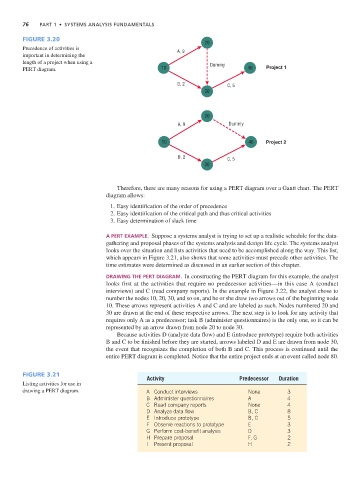
              Precedence of activities is                        A, 9
              important in determining the
              length of a project when using a                              Dummy
              PERT diagram.                                10                           40    Project 1


                                                                 B,2             C, 5
                                                                          30


                                                                          20
                                                                 A, 9             Dummy


                                                            10                          40    Project 2

                                                                 B, 2            C, 5
                                                                          30


                                             Therefore, there are many reasons for using a PERT diagram over a Gantt chart. The PERT
                                         diagram allows:

                                           1. Easy identification of the order of precedence
                                           2. Easy identification of the critical path and thus critical activities
                                           3. Easy determination of slack time

                                         A PERT EXAMPLE.  Suppose a systems analyst is trying to set up a realistic schedule for the data-
                                         gathering and proposal phases of the systems analysis and design life cycle. The systems analyst
                                         looks over the situation and lists activities that need to be accomplished along the way. This list,
                                         which appears in Figure 3.21, also shows that some activities must precede other activities. The
                                         time estimates were determined as discussed in an earlier section of this chapter.
                                         DRAWING THE PERT DIAGRAM.  In constructing the PERT diagram for this example, the analyst
                                         looks first at the activities that require no predecessor activities—in this case A (conduct
                                         interviews) and C (read company reports). In the example in Figure 3.22, the analyst chose to
                                         number the nodes 10, 20, 30, and so on, and he or she drew two arrows out of the beginning node
                                         10. These arrows represent activities A and C and are labeled as such. Nodes numbered 20 and
                                         30 are drawn at the end of these respective arrows. The next step is to look for any activity that
                                         requires only A as a predecessor; task B (administer questionnaires) is the only one, so it can be
                                         represented by an arrow drawn from node 20 to node 30.
                                             Because activities D (analyze data flow) and E (introduce prototype) require both activities
                                         B and C to be finished before they are started, arrows labeled D and E are drawn from node 30,
                                         the event that recognizes the completion of both B and C. This process is continued until the
                                         entire PERT diagram is completed. Notice that the entire project ends at an event called node 80.

              Figure 3.21
                                                       Activity                      Predecessor  Duration
              Listing activities for use in
              drawing a PERT diagram.                  A   Conduct interviews           None         3
                                                       B   Administer questionnaires    A            4
                                                       C   Read company reports         None         4
                                                       D   Analyze data flow            B, C         8
                                                       E   Introduce prototype          B, C         5
                                                       F   Observe reactions to prototype  E         3
                                                       G   Perform cost-benefit analysis  D          3
                                                       H   Prepare proposal             F, G         2
                                                       I    Present proposal            H            2
   104   105   106   107   108   109   110   111   112   113   114