
Page 108 -
P. 108
ChaPter 3 • ProjeCt management 75
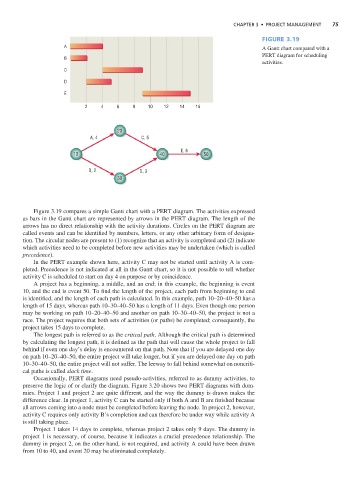
Figure 3.19
A A Gantt chart compared with a
PERT diagram for scheduling
B
activities.
C
D
E
2 4 6 8 10 12 14 16
20
A, 4 C, 5
E, 6
10 40 50
B, 2 D, 3
30
Figure 3.19 compares a simple Gantt chart with a PERT diagram. The activities expressed
as bars in the Gantt chart are represented by arrows in the PERT diagram. The length of the
arrows has no direct relationship with the activity durations. Circles on the PERT diagram are
called events and can be identified by numbers, letters, or any other arbitrary form of designa-
tion. The circular nodes are present to (1) recognize that an activity is completed and (2) indicate
which activities need to be completed before new activities may be undertaken (which is called
precedence).
In the PERT example shown here, activity C may not be started until activity A is com-
pleted. Precedence is not indicated at all in the Gantt chart, so it is not possible to tell whether
activity C is scheduled to start on day 4 on purpose or by coincidence.
A project has a beginning, a middle, and an end; in this example, the beginning is event
10, and the end is event 50. To find the length of the project, each path from beginning to end
is identified, and the length of each path is calculated. In this example, path 10–20–40–50 has a
length of 15 days, whereas path 10–30–40–50 has a length of 11 days. Even though one person
may be working on path 10–20–40–50 and another on path 10–30–40–50, the project is not a
race. The project requires that both sets of activities (or paths) be completed; consequently, the
project takes 15 days to complete.
The longest path is referred to as the critical path. Although the critical path is determined
by calculating the longest path, it is defined as the path that will cause the whole project to fall
behind if even one day’s delay is encountered on that path. Note that if you are delayed one day
on path 10–20–40–50, the entire project will take longer, but if you are delayed one day on path
10–30–40–50, the entire project will not suffer. The leeway to fall behind somewhat on noncriti-
cal paths is called slack time.
Occasionally, PERT diagrams need pseudo-activities, referred to as dummy activities, to
preserve the logic of or clarify the diagram. Figure 3.20 shows two PERT diagrams with dum-
mies. Project 1 and project 2 are quite different, and the way the dummy is drawn makes the
difference clear. In project 1, activity C can be started only if both A and B are finished because
all arrows coming into a node must be completed before leaving the node. In project 2, however,
activity C requires only activity B’s completion and can therefore be under way while activity A
is still taking place.
Project 1 takes 14 days to complete, whereas project 2 takes only 9 days. The dummy in
project 1 is necessary, of course, because it indicates a crucial precedence relationship. The
dummy in project 2, on the other hand, is not required, and activity A could have been drawn
from 10 to 40, and event 20 may be eliminated completely.