
Page 112 -
P. 112
ChaPter 3 • ProjeCt management 79
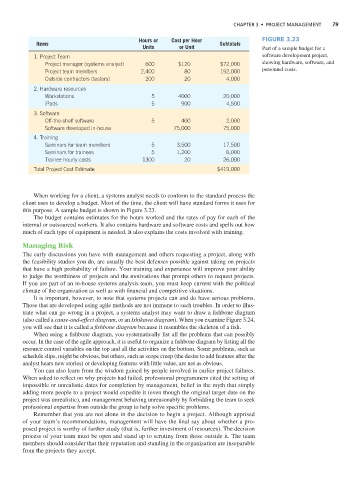
Hours or Cost per Hour Figure 3.23
Items Subtotals
Units or Unit Part of a sample budget for a
1. Project Team software development project,
Project manager (systems analyst) 600 $120 $72,000 showing hardware, software, and
Project team members 2,400 80 192,000 personnel costs.
Outside contractors (testers) 200 20 4,000
2. Hardware resources
Workstations 5 4000 20,000
iPads 5 900 4,500
3. Software
Off-the-shelf software 5 400 2,000
Software developed in-house 75,000 75,000
4. Training
Seminars for team members 5 3,500 17,500
Seminars for trainees 5 1,200 6,000
Trainee hourly costs 1300 20 26,000
Total Project Cost Estimate $419,000
When working for a client, a systems analyst needs to conform to the standard process the
client uses to develop a budget. Most of the time, the client will have standard forms it uses for
this purpose. A sample budget is shown in Figure 3.23.
The budget contains estimates for the hours worked and the rates of pay for each of the
internal or outsourced workers. It also contains hardware and software costs and spells out how
much of each type of equipment is needed. It also explains the costs involved with training.
Managing Risk
The early discussions you have with management and others requesting a project, along with
the feasibility studies you do, are usually the best defenses possible against taking on projects
that have a high probability of failure. Your training and experience will improve your ability
to judge the worthiness of projects and the motivations that prompt others to request projects.
If you are part of an in-house systems analysis team, you must keep current with the political
climate of the organization as well as with financial and competitive situations.
It is important, however, to note that systems projects can and do have serious problems.
Those that are developed using agile methods are not immune to such troubles. In order to illus-
trate what can go wrong in a project, a systems analyst may want to draw a fishbone diagram
(also called a cause-and-effect diagram, or an Ishikawa diagram). When you examine Figure 3.24,
you will see that it is called a fishbone diagram because it resembles the skeleton of a fish.
When using a fishbone diagram, you systematically list all the problems that can possibly
occur. In the case of the agile approach, it is useful to organize a fishbone diagram by listing all the
resource control variables on the top and all the activities on the bottom. Some problems, such as
schedule slips, might be obvious, but others, such as scope creep (the desire to add features after the
analyst hears new stories) or developing features with little value, are not as obvious.
You can also learn from the wisdom gained by people involved in earlier project failures.
When asked to reflect on why projects had failed, professional programmers cited the setting of
impossible or unrealistic dates for completion by management, belief in the myth that simply
adding more people to a project would expedite it (even though the original target date on the
project was unrealistic), and management behaving unreasonably by forbidding the team to seek
professional expertise from outside the group to help solve specific problems.
Remember that you are not alone in the decision to begin a project. Although apprised
of your team’s recommendations, management will have the final say about whether a pro-
posed project is worthy of further study (that is, further investment of resources). The decision
process of your team must be open and stand up to scrutiny from those outside it. The team
members should consider that their reputation and standing in the organization are inseparable
from the projects they accept.