
Page 194 - TPM A Route to World-Class Performance
P. 194
Managing the TPM journey 171
These priorities are linked to the future business vision through the use of
a continuous improvement master plan. The master plan is simply a summary
of intentions laid out against the predictable stages of the TPM change
programme. These are shown in Table 8.2.
The master plan also integrates pillar champion activities to deliver a
single agenda for change. Each milestone of the plan provides a quality check
that the management team are pulling together. Progress towards each
milestone is monitored and supported by the quarterly top-down audit
coaching precess. This looks for evidence of progress bottom-up to highlight
where top-down policy is effective or needs support (see Table 8.2).
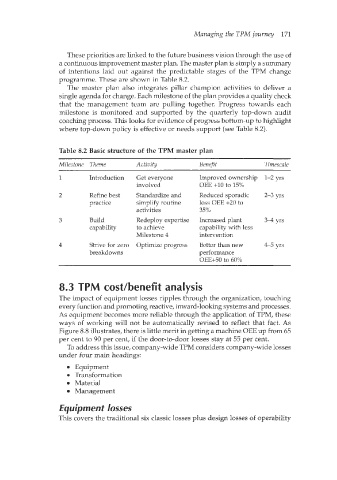
Table 8.2 Basic structure of the TPM master plan
Milestone Theme Activity Benq'it Times ca le
1 Introduction Get everyone Improved ownership 1-2 yrs
involved OEE +10 to 15%
2 Refine best Standardize and Reduced sporadic 2-3 yrs
practice simpw routine loss OEE +20 to
activities 35%
3 Build Redeploy expertise Increased plant %4 yrs
capability to achieve capability with less
Milestone 4 intervention
4 Strive for zero Optimize progress Better than new P5 yrs
breakdowns performance
OEE+50 to 60%
8.3 TPM cost/benefit analysis
The impact of equipment losses ripples through the organization, touching
every function and promoting reactive, inward-looking systems and processes.
As equipment becomes more reliable through the application of TPM, these
ways of working will not be automatically revised to reflect that fact. As
Figure 8.8 illustrates, there is little merit in getting a machine OEE up from 65
per cent to 90 per cent, if the door-to-door losses stay at 55 per cent.
To address this issue, company-wide TPM considers company-wide losses
under four main headings:
Equipment
0 Transformation
MateIial
Management
Equipment losses
This covers the traditional six classic losses plus design losses of operability