
Page 195 - TPM A Route to World-Class Performance
P. 195
172 TPM-A Route to World-Class Performance
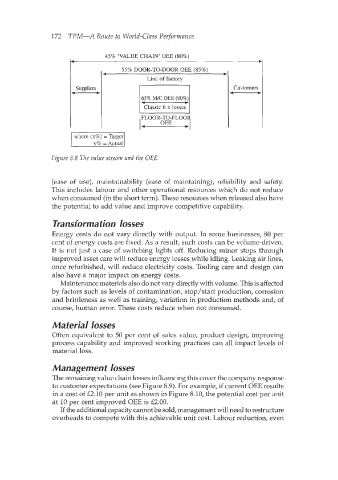
45% ‘VALUE CHAIN’ OEE (80%)
- Line of factory b -
55% DOOR-TO-DOOR OEE (85%)
4
Customers
Suppliers
65% M/C OEE (90%)
4 F
Classic 6 x losses
OEE 4
, FLOOR-TO-FL00
4
Figure 8.8 The value stream and the OEE
(ease of use), maintainability (ease of maintaining), reliability and safety.
This includes labour and other operational resources which do not reduce
when consumed (in the short term). These resources when released also have
the potential to add value and improve competitive capability.
Trans forma tion losses
Energy costs do not vary directly with output. In some businesses, 80 per
cent of energy costs are fixed. As a result, such costs can be volume-driven.
It is not just a case of switching lights off. Reducing minor stops through
improved asset care will reduce energy losses while idling. Leaking air lines,
once refurbished, will reduce electricity costs. Tooling care and design can
also have a major impact on energy costs.
Maintenance materials also do not vary directly with volume. This is affected
by factors such as levels of contamination, stop/start production, corrosion
and brittleness as well as training, variation in production methods and, of
course, human error. These costs reduce when not consumed.
Ma terial losses
Often equivalent to 50 per cent of sales value, product design, improving
process capability and improved working practices can all impact levels of
material loss.
Management losses
The remaining value chain losses influencing this cover the company response
to customer expectations (see Figure 8.9). For example, if current OEE results
in a cost of E2.10 per unit as shown in Figure 8.10, the potential cost per unit
at 10 per cent improved OEE is E2.00.
If the additional capacity cannot be sold, management will need to restructure
overheads to compete with this achievable unit cost. Labour reduction, even