Page 196 - TPM A Route to World-Class Performance
P. 196

Managing the TPM journey  173


                            Customers        Drive the business      Necessary
                                                                     company
                                                                        -.
                              A                                   I   resmmes  I


                                                 QUALITY

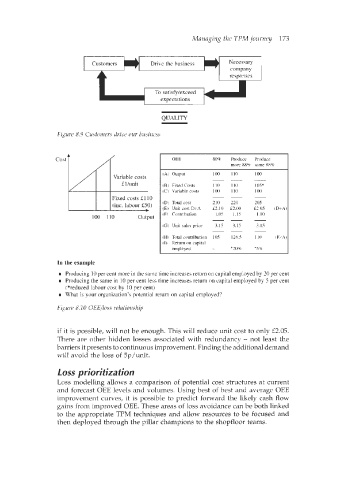
                  Figure 8.9 Customers drive OUT  business


                  cost                              OEE         BOW   Prduce   Prcduce
                                                                     more88%  same888
                                                 (A)  Onput     100   110   100
                                  Variable costs                -- -
                                     fllunit     (B) FixtdCosts   110   110   105*
                                                 (c) Variablecosts   100   110   100
                                  Fixed costs €110              ~~
                                  (inc. labour €50)   @)  Totalcost   210   220   205
                                            +    (E) Unit cost IXA   €2.10   €2.00   €2.05   @+A
                                                                             1.10
                                                                      1.15
                                                                 1.05
                            100  110      Output   0 Contribution   --
                                                 (G) Unit sales price   3.15   3.15   3.15
                                                                ~~
                                                    Totalcontribution   105   126.5   110   (FXA
                                                 (I) Rchxnoncapital
                                                    employed    -    +20W   +5 (t
                  In the example
                    Producing  10 per cent more in the same time increases return on capital employed by 20 per cent
                    Producing the same in 10 per cent less time increases return on capital employed by 5 per cent
                    (*reduced labour cost by  10 per cent)
                    What is your organization’s potential return on capital employed?
                  Figure 8.10  OEE/loss relationship


                  if it is possible, will not be enough. This will reduce unit cost to only €2.05.
                  There are other hidden losses associated with redundancy - not least the
                  barriers it presents to continuous improvement.  Finding the additional demand
                  will avoid the loss of  5p/unit.

                  Loss prioritization
                  Loss modellmg allows a comparison of potential cost structures at current
                  and forecast OEE levels and volumes. Using best of  best and average OEE
                  improvement  Curves, it is possible to predict forward the likely cash flow
                  gains from improved OEE. These areas of  loss avoidance can be both linked
                  to the appropriate TPM techniques and allow resources to be focused and
                  then deployed through the pillar champions to the shopfloor teams.
   191   192   193   194   195   196   197   198   199   200   201