
Page 44 - TPM A Route to World-Class Performance
P. 44
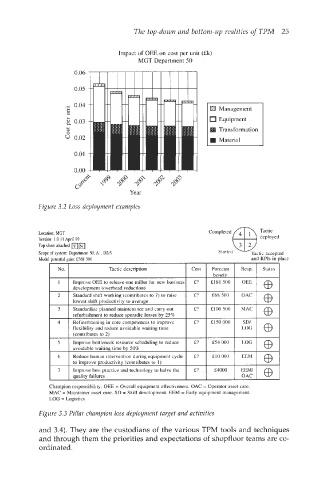
The top-down and  bottom-up realities of  TPM  25

                                 Impact of OEE on cost per unit (Ek)
                                       MGT Department 50
                     0.06
                     0.05

                   .C - 0.04
                   s
                   -  0.03                                   Equipment

                   u 0.02                                 I Transformation
                                                             Material
                     0.01
                     0.00


                                    Year
            Figure 3.2 Loss deployment examples


            Location: MGT                                               deployed
            Top sheet attached mm
            Version:  1.0  II April 99
            Scope of system: Department 50, AI, D2/3
            Model potential gain: f568 500                            and KPIs in place
              I  No.  I        Tactic description   I  Cost  I  Forecast  I  Resp.  I  Status  I

                 1   Improve OEE to release one miller for new business   f?   2181 500   OEE   03
                     development  (overhead reduction)
                 2   Standard shift working (contributes  to 7) to raise   f?   E68 500   OAC   @
                     lowest shift productivity  to average
                 3   Standardize planned  maintenance and carry out   E?   f100500   MAC   @
                     refurbishment to reduce sporadic losses by 25%
                 4   Refinehraining in core competences to improve   E?   f150000   SDI
                     flexibility  and reduce avoidable waiting time   LOG   @
                     (contributes to 2)
                 5   Improve bottleneck  resource scheduling to reduce   f?   f54 000   LOG   @
                     avoidable waiting time by 50%
                 6   Reduce human intervention  during equipment cycle   f?   f 10 000   EEM   @
                     to improve productivity  (contributes to I)
                 7   Improve best practice  and technology to halve the   f?   f4000   EEM/  @
                     quality failures                              OAC


            and 3.4). They are the custodians of  the various TPM tools and techniques
            and through them the priorities and expectations of  shopfloor teams are co-
            ordinated.