
Page 40 - TPM A Route to World-Class Performance
P. 40
Assessing the true costs and benefits of TPM 21
0 most importantly, it provides a development route to enhance the impact
and develop the capability of key personnel (see Figure 2.3).
Repeated surveys of industry show that the limit to growth of manufacturing
is not the lack of finance but the lack of both engineering and management
skills. Undoubtedly, TPM’s ability to release this is the greatest potential of
all.
2.4 The loss model: a management
development tool
In Chapter 1, we introduced the view that customer expectations should
drive the company and therefore the company’s operations’ response (Figure
1.1). Then we introduced the management challenge presented by improved
equipment effectiveness.
Here we look more closely at the TPM-derived loss model, an important
management tool to deliver a Totally Productive Operation.
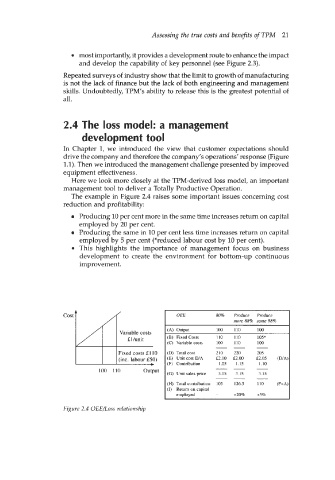
The example in Figure 2.4 raises some important issues concerning cost
reduction and profitability:
Producing 10 per cent more in the same time increases return on capital
employed by 20 per cent.
Producing the same in 10 per cent less time increases return on capital
employed by 5 per cent (*reduced labour cost by 10 per cent).
0 This highlights the importance of management focus on business
development to create the environment for bottom-up continuous
improvement.
/
OEE 80% Produce Pmduce
more 88% same 88%
Variable costs
&I /unit (B) Fixed Costs 110 110 105*
(C) Variable costs 100 110 100
-- -
Fixed costs Ell0 (D) Total cost 210 220 205
(inc. labour f50) (E) Unit cost D/A f2.10 f2.00 f2.05 (D/A>
1.05
1.10
1.15
______) (F) Contribution -~
100 110 output
(G) Unit sales price 3.15 3.15 3.15
--
-
(H) Total contribution 105 126.5 110 (FxA:
(I) Return on capital
employed - ~20% +56
Figure 2.4 OEE/Loss relationship