
Page 493 - Bruce Ellig - The Complete Guide to Executive Compensation (2007)
P. 493
Chapter 8. Long-Term Incentives 479
As the termination date is unknown, the lattice model may again be the preferable fair-value
model. Because this may be viewed as deferred compensation, Section 409A of the IRC may
apply. The plan has to be carefully crafted to avoid constructive receipt to the individual.
However, it may be advantageous to the executive in order to pay taxes at time of award (since
receipt is virtually guaranteed) and thereby establish a cost basis for long-term capital gains.
Variable Number of Shares and Fixed Date (VSFD). Instead of varying the date restrictions
lapse based on company performance, some plans set the payout date, but the number of shares
to be awarded is determined by company performance. These are typically called performance-
share plans, although the case could be made to use the same name for variable-date plans, too.
Performance-share plans were introduced in the early 1930s and again in the early 1970s to
offset a prolonged period of flat stock prices and therefore little appreciation in stock options.
To illustrate how they work, assume the same 15,000 shares highlighted in Table 8-54 were
awarded, also with a three-year cliff vest based on the compound growth in earnings per share
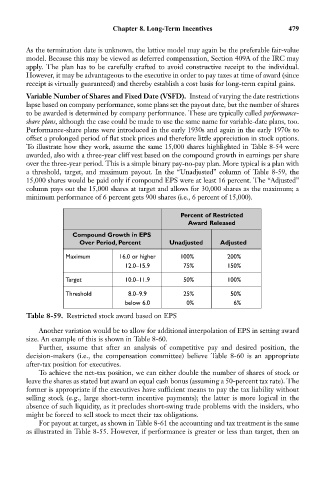
over the three-year period. This is a simple binary pay-no-pay plan. More typical is a plan with
a threshold, target, and maximum payout. In the “Unadjusted” column of Table 8-59, the
15,000 shares would be paid only if compound EPS were at least 16 percent. The “Adjusted”
column pays out the 15,000 shares at target and allows for 30,000 shares as the maximum; a
minimum performance of 6 percent gets 900 shares (i.e., 6 percent of 15,000).
Percent of Restricted
Award Released
Compound Growth in EPS
Over Period, Percent Unadjusted Adjusted
Maximum 16.0 or higher 100% 200%
12.0–15.9 75% 150%
Target 10.0–11.9 50% 100%
Threshold 8.0–9.9 25% 50%
below 6.0 0% 6%
Table 8-59. Restricted stock award based on EPS
Another variation would be to allow for additional interpolation of EPS in setting award
size. An example of this is shown in Table 8-60.
Further, assume that after an analysis of competitive pay and desired position, the
decision-makers (i.e., the compensation committee) believe Table 8-60 is an appropriate
after-tax position for executives.
To achieve the net-tax position, we can either double the number of shares of stock or
leave the shares as stated but award an equal cash bonus (assuming a 50-percent tax rate). The
former is appropriate if the executives have sufficient means to pay the tax liability without
selling stock (e.g., large short-term incentive payments); the latter is more logical in the
absence of such liquidity, as it precludes short-swing trade problems with the insiders, who
might be forced to sell stock to meet their tax obligations.
For payout at target, as shown in Table 8-61 the accounting and tax treatment is the same
as illustrated in Table 8-55. However, if performance is greater or less than target, then an