
Page 498 - Bruce Ellig - The Complete Guide to Executive Compensation (2007)
P. 498
484 The Complete Guide to Executive Compensation
business risks. The rationale for midcourse change is that if such factors had been known
at the beginning of the period, the goal would have been appropriately modified. Thus,
midcourse corrections require separating impacting factors from actual performance—a
measurement more conceptually understandable than practically administered in many
situations. Furthermore, it is important to remember that the true entrepreneur has no one
changing his or her goals and profit targets—that individual is stuck with making the best of
a bad situation. Some argue that it should not be any different for the professional manager.
For those concerned about altering goals during the period, it is logical to keep the plan
cycle as short as possible. By definition, the further out in time the plan, the more suspect the
conclusions. Therefore, a three-year plan is less likely to need change than a five-year program.
Even so, setting targets as short as three years may be hazardous in cyclical industries.
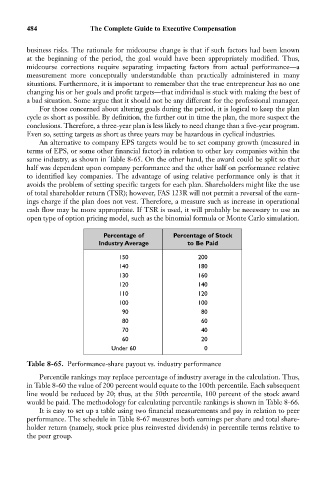
An alternative to company EPS targets would be to set company growth (measured in
terms of EPS, or some other financial factor) in relation to other key companies within the
same industry, as shown in Table 8-65. On the other hand, the award could be split so that
half was dependent upon company performance and the other half on performance relative
to identified key companies. The advantage of using relative performance only is that it
avoids the problem of setting specific targets for each plan. Shareholders might like the use
of total shareholder return (TSR); however, FAS 123R will not permit a reversal of the earn-
ings charge if the plan does not vest. Therefore, a measure such as increase in operational
cash flow may be more appropriate. If TSR is used, it will probably be necessary to use an
open type of option pricing model, such as the binomial formula or Monte Carlo simulation.
Percentage of Percentage of Stock
Industry Average to Be Paid
150 200
140 180
130 160
120 140
110 120
100 100
90 80
80 60
70 40
60 20
Under 60 0
Table 8-65. Performance-share payout vs. industry performance
Percentile rankings may replace percentage of industry average in the calculation. Thus,
in Table 8-60 the value of 200 percent would equate to the 100th percentile. Each subsequent
line would be reduced by 20; thus, at the 50th percentile, 100 percent of the stock award
would be paid. The methodology for calculating percentile rankings is shown in Table 8-66.
It is easy to set up a table using two financial measurements and pay in relation to peer
performance. The schedule in Table 8-67 measures both earnings per share and total share-
holder return (namely, stock price plus reinvested dividends) in percentile terms relative to
the peer group.