
Page 499 - Bruce Ellig - The Complete Guide to Executive Compensation (2007)
P. 499
Chapter 8. Long-Term Incentives 485
1. Array the values being measured low to high.
2. Determine own company numerical rank position.
3. Subtract 1 from own rank position and 1 from the total number of values.
4. Divide adjusted rank by adjusted total.
5. Subtract result from 1 to get percentile.
Thus, if own company is ranked third among nine other companies (10 counting oneself),
then: 3 1 2 and 10 1 9.Therefore, 2 9 0.222 and 1 0.222 0.778, or
the seventy-eighth percentile.
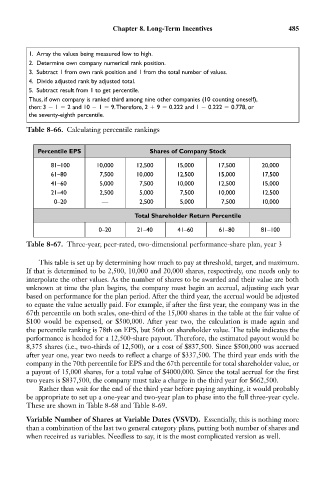
Table 8-66. Calculating percentile rankings
Percentile EPS Shares of Company Stock
81–100 10,000 12,500 15,000 17,500 20,000
61–80 7,500 10,000 12,500 15,000 17,500
41–60 5,000 7,500 10,000 12,500 15,000
21–40 2,500 5,000 7,500 10,000 12,500
0–20 — 2,500 5,000 7,500 10,000
Total Shareholder Return Percentile
0–20 21–40 41–60 61–80 81–100
Table 8-67. Three-year, peer-rated, two-dimensional performance-share plan, year 3
This table is set up by determining how much to pay at threshold, target, and maximum.
If that is determined to be 2,500, 10,000 and 20,000 shares, respectively, one needs only to
interpolate the other values. As the number of shares to be awarded and their value are both
unknown at time the plan begins, the company must begin an accrual, adjusting each year
based on performance for the plan period. After the third year, the accrual would be adjusted
to equate the value actually paid. For example, if after the first year, the company was in the
67th percentile on both scales, one-third of the 15,000 shares in the table at the fair value of
$100 would be expensed, or $500,000. After year two, the calculation is made again and
the percentile ranking is 78th on EPS, but 56th on shareholder value. The table indicates the
performance is headed for a 12,500-share payout. Therefore, the estimated payout would be
8,375 shares (i.e., two-thirds of 12,500), or a cost of $837,500. Since $500,000 was accrued
after year one, year two needs to reflect a charge of $337,500. The third year ends with the
company in the 70th percentile for EPS and the 67th percentile for total shareholder value, or
a payout of 15,000 shares, for a total value of $4000,000. Since the total accrual for the first
two years is $837,500, the company must take a charge in the third year for $662,500.
Rather than wait for the end of the third year before paying anything, it would probably
be appropriate to set up a one-year and two-year plan to phase into the full three-year cycle.
These are shown in Table 8-68 and Table 8-69.
Variable Number of Shares at Variable Dates (VSVD). Essentially, this is nothing more
than a combination of the last two general category plans, putting both number of shares and
when received as variables. Needless to say, it is the most complicated version as well.