
Page 496 - Bruce Ellig - The Complete Guide to Executive Compensation (2007)
P. 496
482 The Complete Guide to Executive Compensation
total award would be $3.9 million. The company would have taken a tax deduction in that
amount after the third year, since the individual would have a like amount as income. The
stock portion of the award would be treated as an equity grant with fair-value accounting
based on the $100 share, however, the cash portion would be considered a liability award and
subject to variable accounting reflecting changes in the stock price quarterly. The cash bonus
is probably sufficient to pay the tax liability without having to sell any of the stock. Note that
if the cash bonus is set in terms of FMV at time of award, it may not be sufficient to meet tax
liabilities. By the time restrictions are lifted, the FMV has probably increased! Conversely,
the cash bonus may be more than required if FMV has decreased.
After the third year, a new table would be devised for another three-year period. At such
time, the list of candidates would again be reviewed. Some companies freeze the list for each
three-year period, thus precluding any additions. Others make additions (usually as a result of
replacing a terminated executive) but are careful to stay within a control total number of shares.
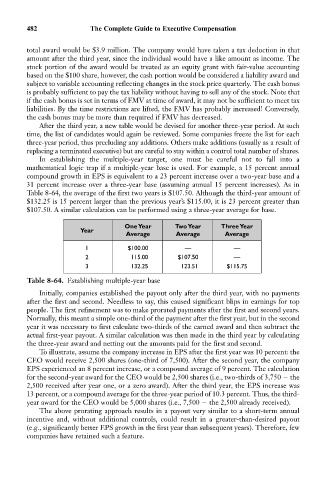
In establishing the multiple-year target, one must be careful not to fall into a
mathematical logic trap if a multiple-year base is used. For example, a 15 percent annual
compound growth in EPS is equivalent to a 23 percent increase over a two-year base and a
31 percent increase over a three-year base (assuming annual 15 percent increases). As in
Table 8-64, the average of the first two years is $107.50. Although the third-year amount of
$132.25 is 15 percent larger than the previous year’s $115.00, it is 23 percent greater than
$107.50. A similar calculation can be performed using a three-year average for base.
One Year Two Year Three Year
Year
Average Average Average
1 $100.00 — —
2 115.00 $107.50 —
3 132.25 123.51 $115.75
Table 8-64. Establishing multiple-year base
Initially, companies established the payout only after the third year, with no payments
after the first and second. Needless to say, this caused significant blips in earnings for top
people. The first refinement was to make prorated payments after the first and second years.
Normally, this meant a simple one-third of the payment after the first year, but in the second
year it was necessary to first calculate two-thirds of the earned award and then subtract the
actual first-year payout. A similar calculation was then made in the third year by calculating
the three-year award and netting out the amounts paid for the first and second.
To illustrate, assume the company increase in EPS after the first year was 10 percent: the
CEO would receive 2,500 shares (one-third of 7,500). After the second year, the company
EPS experienced an 8 percent increase, or a compound average of 9 percent. The calculation
for the second-year award for the CEO would be 2,500 shares (i.e., two-thirds of 3,750 the
2,500 received after year one, or a zero award). After the third year, the EPS increase was
13 percent, or a compound average for the three-year period of 10.3 percent. Thus, the third-
year award for the CEO would be 5,000 shares (i.e., 7,500 the 2,500 already received).
The above prorating approach results in a payout very similar to a short-term annual
incentive and, without additional controls, could result in a greater-than-desired payout
(e.g., significantly better EPS growth in the first year than subsequent years). Therefore, few
companies have retained such a feature.