
Page 500 - Bruce Ellig - The Complete Guide to Executive Compensation (2007)
P. 500
486 The Complete Guide to Executive Compensation
Percentile EPS Shares of Company Stock
81–100 6,667 8,334 10,000 11,667 13,334
61–80 5,000 6,667 8,334 10,000 11,667
41–60 3,334 5,000 6,667 8,334 10,000
21–40 1,667 3,334 5,000 6,667 8,334
0–20 — 1,667 3,334 5,000 6,667
Total Shareholder Return Percentile
0–20 21–40 41–60 61–80 81–100
Table 8-68. Indexed, peer-rated, two-dimensional performance-share plan, year 2
Percentile EPS Shares of Company Stock
81–100 3,334 4,167 5,000 5,883 6,667
61–80 2,500 3,334 4,167 5,000 5,833
41–60 1,667 2,500 3,334 4,167 5,000
21–40 833 1,667 2,500 3,334 4,167
0–20 — 833 1,667 2,500 3,334
Total Shareholder Return Percentile
0–20 21–40 41–60 61–80 81–100
Table 8-69. Indexed, peer-rated, two-dimensional performance-share plan, year 1
Number Shares Awarded Based on
Consecutive Years Performance
Compound EPS
2 3 4 5
Growth
18% and up 20,000 30,000 40,000 50,000
16.0–17.9 15,000 20,000 30,000 40,000
14.0–15.9 7,500 12,500 17,500 25,000
12.0–13.9 5,000 7,500 10,000 12,500
10.0–11.9 2,500 5,000 7,500 10,000
8.0–9.9 — 2,500 5,000 7,500
Below 8.0 — — — —
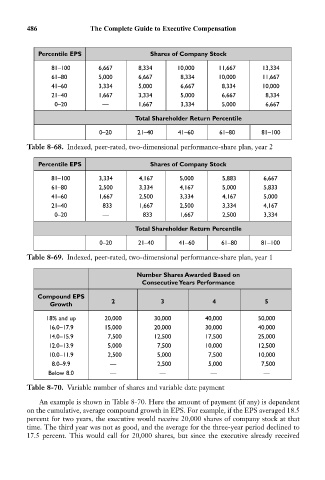
Table 8-70. Variable number of shares and variable date payment
An example is shown in Table 8-70. Here the amount of payment (if any) is dependent
on the cumulative, average compound growth in EPS. For example, if the EPS averaged 18.5
percent for two years, the executive would receive 20,000 shares of company stock at that
time. The third year was not as good, and the average for the three-year period declined to
17.5 percent. This would call for 20,000 shares, but since the executive already received