
Page 303 - The extraordinary leader
P. 303
280 • Appendix
replication of their own data. In most organizations, leaders still ask the ques-
tion, “Is that true in our organization?” When leaders see how their own data
shows that great leaders create substantially higher levels of employee satis-
faction and commitment, they begin to be more serious and dedicated in their
efforts to become extraordinary leaders.
We frequently get questions about differences between U.S. and interna-
tional leaders. As we have used the Extraordinary Leader approach around
the world, we have found a large number of similarities between leaders in
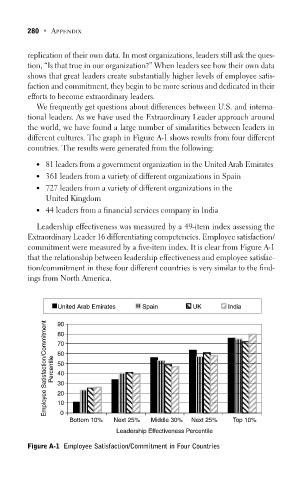
different cultures. The graph in Figure A-1 shows results from four different
countries. The results were generated from the following:
● 81 leaders from a government organization in the United Arab Emirates
● 361 leaders from a variety of different organizations in Spain
● 727 leaders from a variety of different organizations in the
United Kingdom
● 44 leaders from a financial services company in India
Leadership effectiveness was measured by a 49-item index assessing the
Extraordinary Leader 16 differentiating competencies. Employee satisfaction/
commitment were measured by a five-item index. It is clear from Figure A-1
that the relationship between leadership effectiveness and employee satisfac-
tion/commitment in these four different countries is very similar to the find-
ings from North America.
United Arab Emirates Spain UK India
Employee Satisfaction/Commitment Percentile 70
90
80
60
50
40
30
20
10
0
Bottom 10% Next 25% Middle 30% Next 25% Top 10%
Leadership Effectiveness Percentile
Figure A-1 Employee Satisfaction/Commitment in Four Countries