
Page 307 - The extraordinary leader
P. 307
284 • Appendix
series of rating by direct reports on employee satisfaction. One item assessed
the overall effectiveness of each manager (e.g., “Overall, I feel my immedi-
ate supervisor/manager is doing a good job.”) This item was not one of the
360 items used to calculate the leadership effectiveness index. Leaders with
strengths were compared with the leadership effectiveness index (the average
of all 360 items), an independent rating of managerial effectiveness (the item,
“Overall I feel that my manager is doing a good job”) and an employee satis-
faction index (12 items assessing satisfaction with the company, job, direction
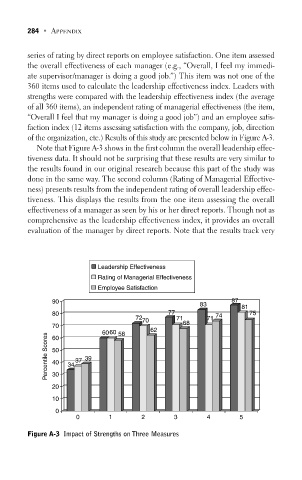
of the organization, etc.) Results of this study are presented below in Figure A-3.
Note that Figure A-3 shows in the first column the overall leadership effec-
tiveness data. It should not be surprising that these results are very similar to
the results found in our original research because this part of the study was
done in the same way. The second column (Rating of Managerial Effective-
ness) presents results from the independent rating of overall leadership effec-
tiveness. This displays the results from the one item assessing the overall
effectiveness of a manager as seen by his or her direct reports. Though not as
comprehensive as the leadership effectiveness index, it provides an overall
evaluation of the manager by direct reports. Note that the results track very
Leadership Effectiveness
Rating of Managerial Effectiveness
Employee Satisfaction
90 87
83
81
80 77 74 75
72 70 71 71
70 6060 58 62 68
Percentile Scores 50 34 37 39
60
40
30
20
10
0
0 1 2 3 4 5
Figure A-3 Impact of Strengths on Three Measures