Page 305 - The extraordinary leader
P. 305

282 • Appendix


                    No. of     No. of    No. of
        Data     Assessments   Leaders   Survey         Organization(s)
        Set No.   Completed   Assessed    Items          Description
        1           2,872        290       64      Research and Development
        2          10,691        762       36      Bank/Investment
        3           4,178        639       45      Generic Survey—Many Different
                                                     Organizations
        4           1,346        19        66      Chemicals
        5           3,782        486       18      Food Processing
        6           6,365        687       54      Food Sales
        7           9,395        925       47      Foods
        8            137         17        86      Manufacturing
        9           2,670        349       48      Foods
        10         21,786      3,022       60      High Technology
        11          2,573        357       61      High Technology
        12          1,502        147       52      Information Processing
        13          3,512        259       84      Publishing
        14         19,671      2,030        61     Generic Survey—Many Different
                                                     Organizations
        15          7,290        943        60     Oil—Upstream
        16          1,221        180        53     High-Technology Manufacturing
        17          2,648        276        91     High-Technology Development
        18          2,177        262        73     High Technology
        19         11,048      1,123        88     High-Technology Development
        20         12,060      1,175        79     High-Technology Sales/Service
        21          1,183        165        51     Automotive
        22          9,323        901        50     Foods
        23          1,831        210        99     Foods
        24          2,001        194        50     Restaurant
        25          7,155      1,009        66     Research and Development
        26         14,630      2,125        70     Generic Survey—Many Different
        27         62,919      6,716        73     Generic Survey—Many Different
                                                     Organizations
        28          2,300        146        52     Forest Products
        29          2,174        196        60     Paper
        30          4,083        338        54     Banking
        31          1,297        130        55     Mortgage Bank
        32          1,303        126        50     Insurance
        Total     237,123     26,314     1,956
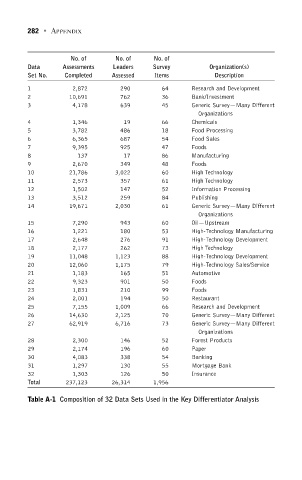
        Table A-1 Composition of 32 Data Sets Used in the Key Differentiator Analysis
   300   301   302   303   304   305   306   307   308   309   310