
Page 101 - The Geological Interpretation of Well Logs
P. 101
8
SONIC OR ACOUSTIC LOGS
8.1 Generalities Principal uses
Quantitatively, the sonic log is used to evaluate porosity
The log
in liquid-filled holes. As an aid to seismic interpretation
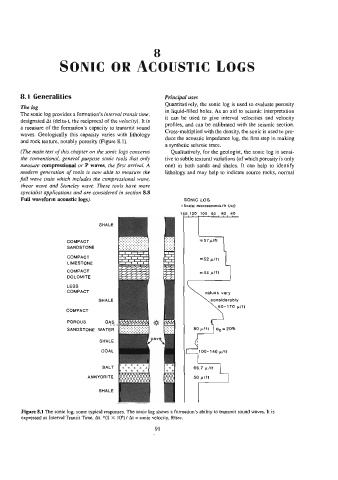
The sonic log provides a formation’s interval transit time,
it can be used to give interval velocities and velocity
designated At (delta-t, the reciprocal of the velocity). It is
profiles, and can be calibrated with the seismic section.
a measure of the formation’s capacity to transmit sound
Cross-multiplied with the density, the sonic is used to pro-
waves. Geologically this capacity varies with lithology
duce the acoustic impedance log, the first step in making
and rock texture, notably porosity (Figure 8.1).
a synthetic seismic trace.
(The main text of this chapter on the sonic logs concerns Qualitatively, for the geologist, the sonic log is sensi-
the conventional, general purpose sonic tools that only tive to subtle textural variations (of which porosity is only
measure compressional or P waves, the first arrival. A one) in both sands and shales. It can help to identify
modern generation of tools is now able to measure the lithology and may help to indicate source rocks, normal
full wave train which includes the compressional wave,
shear wave and Stoneley wave. These tools have more
specialist applications and are considered in section 8.8
Full waveform acoustic logs). SONIC LOG
*Scale: microseconds/ft (At)
140 120 100 80 6o 40
SHALE
GOMPACT = 57 pitt
SANDSTONE
COMPACT
=52 p/ft
LIMESTONE
COMPACT =44 pitt
DOLOMITE
LESS
COMPACT
yalues vary
SHALE considerably
60-170 pift
COMPACT
POROUS AS
SANDSTONE WATER
SHALE
100-140 p/ft
COAL
SALT 66.7 pitt
ANHYDRITE 50 pitt
SHALE
Figure 8.1 The sonic log: some typical responses. The sonic log shows a formation’s ability to transmit sound waves. It is
expressed as Interval Transit Time, At. *(1 X 10°)/ At = sonic velocity, ft/sec.
91