
Page 102 - The Geological Interpretation of Well Logs
P. 102
- THE GEOLOGICAL INTERPRETATION OF WELL LOGS -
Table 8.1 The principal uses of the sonic log (conventional, compressiona) wave tools).
Discipline Used for Knowing
Quantitative Petrophysics Porosity Matrix velocity
Fluid velocity
Seismic Interval velocity Integrated travel time
Seismic markers
Seismic calibration Check shots
Acoustic impedance Direct use of sonic log
Qualitative and Geology Lithology Matrix and mineral velocities
semi-quantitative Correlation
Texture
Fracture identification Density log porosities
Compaction and overpressure Normal compaction trends
Geochemistry Source rock evaluation Resistivity log values
compaction and overpressure and to some extent frac- to the typical seismic signal (sonic and seismic velocities
tures. It is frequently used in correlation (Table 8.1). are routinely compared) which has a content in the
10-50 hertz range (i.e. 10-50 cycles per second) and with
wavelengths of 30m-50m (see Section 8.7, Seismic
8.2 Principles of measurement
applications).
The conventional, general purpose sonic tools measure
the time it takes for a sound pulse to travel between a 8.3 Tools
transmitter and a receiver, mounted a set distance away
Modem sonic tools do not consist of just a single emitter
along the logging tool. The pulse measured is that of the
and a single receiver, but of a number of both transmitters
compressional or ‘P’ wave (Figure 8.2) and tool design
and receivers, the actual arrangement depending on the
enables the velocity of this wave in the formation to be
too] type. Modern designs allow unwanted borehole and
measured. The compressional wave is simply the fastest
tool effects to be largely eliminated and give a reliable
or ‘first arrival’, in which particles vibrate in the direction
measure of formation values even in quite poor borehole
of the sense of movement. The compressional wave is fol-
conditions. Typical tool design and use of compensation
lowed by shear and Stoneley waves (Figure 8.2) which, in
can be illustrated by the borehole-compensated (BHC)
the conventional tools, are ignored but in the moder array
sonic tool (Figure 8.4).
acoustic tools, can be fully measured (Section 8.8).
Typical sonic tool transmitters (transducers) are either
magnetostrictive or, more commonly, piezoelectric and
Stanaley
translate an electrical signal into an ultrasonic vibration.
Shear
Receivers are usually piezoelectric, and convert pressure
waves into electromagnetic signals which can be amplified Compressianal
to provide the logging signal. Piezoelectric materials have te
a type of structure which, when a stress is applied, shows bmw
t
separation of centres of negative and positive charge, thus
First Motian
creating a polarisation charge. It is this, amplified, which
gives an electrical signal. In piezoelectric transmitters, the
application of an electrical charge causes a change in vol-
ume which can be translated into a pressure pulse. A
l LL + L i L 1 1 4
common piezoelectric material used is lead zirconate
0 $00 1000 1500 2000 2600 3000 3500 4000 4500 5000
titanate or PZT.
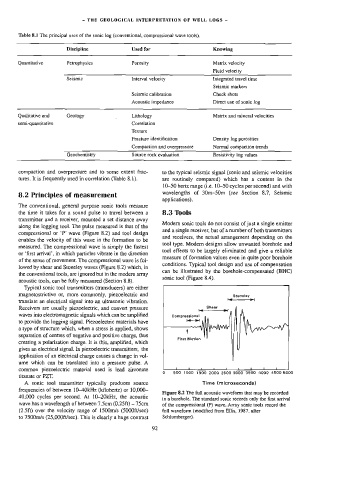
A sonic tool transmitter typically produces source Time {microseconds}
frequencies of between 10-40kHz (kilohertz) or 10,000-
Figure 8.2 The full acoustic waveform that may be recorded
40,000 cycles per second. At 10-20kHz, the acoustic
in a borehole. The standard sonic records only the first arrival
wave has a wavelength of berween 7.5cm (0.25ft} — 75cm of the compressional (P) wave. Array sonic tools record the
(2.5ft) over the velocity range of 1500m/s (S000ft/sec)} full waveform (modified from Ellis, 1987, after
to 7500m/s (25,000ft/sec). This is clearly a huge contrast Schlumberger}.
92