Page 97 - The Geological Interpretation of Well Logs
P. 97

-  THE  GAMMA  RAY  AND  SPECTRAL  GAMMA  RAY  LOGS  -

                                                                                100%  illite  ‘point’
                                               possible  100%  kaolinite  ,
                 20                                                             —
                                               montmorillonite,  illite  ‘clay  ling’   —_—
                                                          —_—   —_—_
                                                —_—_


                            kaolinite


                                                                      +—  70%  illite
                                                                    \  oe
                                                                  STONEY        .
                                                               Bins     40%  micas

                  ae  mic                                            bs

                                                                                        feldspar  line

                                                             80%  glauconite


                                                        3
                                                      K  {%)
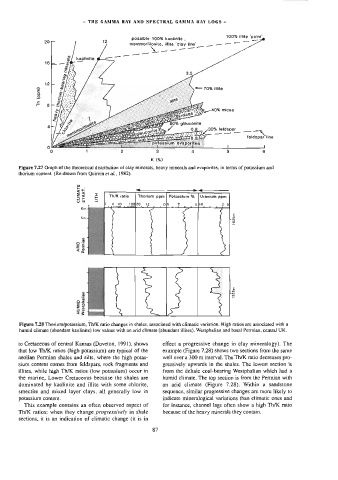
        Figure  7.27  Graph  of  the  theoretical  distribution  of  clay  minerals,  heavy  minerals  and  evaporites,  in  terms  of  potassium  and
        thorium  content.  (Re-drawn  from  Quirein  ef  al.,  1982).

                            ui   .
                            E  &                 ~<               —_  >


                            £  ©   =   ThiK  ratio   Thorium  ppm|   Potassium  % |  Uranium  ppm
                            on    a
                                        Lfu22,  Jeol,  12   0
                                         0
                              Gin        Lauda           ,
                                                                                  lg
                              5m                                                   Pa
                                                                                   2
                            o   5  8
                            «&
                            <2


                                                                                   é
                                                                                  Ls
                              s                                                    ©
                            o8
                            s  3
                            23
                            tz
        Figure  7.28  Thorium/potassium,  Th/K  ratio  changes  in  shales,  associated  with  climatic  variation.  High  ratios  are  associated  with  a
        humid  climate  (abundant  kaolinite)  low  values  with  an  arid  climate  (abundant  illites}.  Westphalian  and  basal  Permian,  central  UK.

        to  Cretaceous  of  central  Kansas  (Doveton,  1991),  shows   effect  a  progressive  change  in  clay  mineralogy).  The
        that  low  Th/K  ratios  (high  potassium)  are  typical  of  the   example  (Figure  7.28)  shows  two  sections  from  the  same
        aeolian  Permian  shales  and  silts,  where  the  high  potas-   well  over  a  300  m  interval.  The  Th/K  ratio  decreases  pro-
        sium  content  comes  from  feldspars,  rock  fragments  and   gressively  upwards  in  the  shales.  The  lowest  section  is
        illites,  while  high  Th/K  ratios  (low  potassium)  occur  in   from  the  deltaic  coal-bearing  Westphalian  which  had  a
        the  marine,  Lower  Cretaceous  because  the  shales  are   humid  climate.  The  top  section  is  from  the  Permian  with
        dominated  by  kaolinite  and  illite  with  some  chlorite,   an  arid  climate  (Figure  7.28).  Within  a  sandstone
        smectite  and  mixed  layer  clays,  all  generally  low  in   sequence,  similar  progressive  changes  are  more  likely  to
        potassium  content.                               indicate  mineralogical  variations  than  climatic  ones  and
          This  example  contains  an  often  observed  aspect  of   for  instance,  channel  lags  often  show  a  high  Th/K  ratio
        Th/K  ratios:  when  they  change  progressively  in  shale   because  of  the  heavy  minerals  they  contain.
        sections,  it  is  an  indication  of  climatic  change  (it  is  in
                                                       87
   92   93   94   95   96   97   98   99   100   101   102