
Page 94 - The Geological Interpretation of Well Logs
P. 94
- THE GEOLOGICAL INTERPRETATION OF WELL LOGS -
uu
c
$
GAMMA RAY API oo
® a #
0 60 110} $228 §
T T T T T % as £ o
o size
Cc
© -_
c @
= s
tc on
c a
@
wo
© << |
2
a
©
QoQ (clay volume)
GRmax
0 0 50 100%
5 be
deflection
GR
relative
20m + GRmin
<=!
coarse fine silt clay
sand
LITHOLOGY/GRAIN SIZE
35m
A. LOGS B. GRAPHIC RELATIONSHIP (schematic)
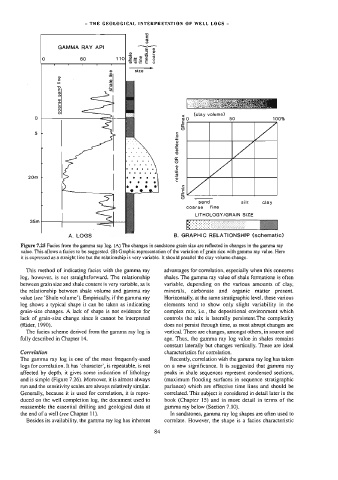
Figure 7.25 Facies frorn the garnma ray log. (A) The changes in sandstone grain size are reflected in changes in the gamma ray
value. This allows a facies to be suggested. {(B) Graphic representation of the variation of grain size with gamma ray value. Here
it is expressed as a straight line but the relationship is very variable. It should parallel the clay volume change.
This method of indicating facies with the gamma ray advantages for correlation, especially when this concems
log, however, is not straightforward. The relationship shales. The gamma ray value of shale formations is often
between grain size and shale content is very variabie, as 1s vanable, depending on the various amounts of clay,
the relationship between shale volume and gamma ray minerals, carbonate and organic matter present.
value (see ‘Shale volume’). Empirically, if the gamma ray Horizontally, at the same stratigraphic level, these various
log shows a typical shape it can be taken as indicating elements tend to show only slight variability in the
grain-size changes. A lack of shape is not evidence for complex mix, Le., the depositional environment which
lack of grain-size change since it cannot be interpreted controls the mix is laterally persistent.The complexity
(Rider, 1990). does not persist through time, as most abrupt changes are
The facies scheme derived from the gamma ray log is vertical. There are changes, amongst others, in source and
fully described in Chapter 14. age. Thus, the gamma ray log value in shales remains
constant laterally but changes vertically. These are ideal
Correlation characteristics for correlation.
The gamma ray log is one of the most frequently-used Recently, correlation with the gamma ray log has taken
logs for correJation, It has ‘character’, is repeatable, is not on a new significance. It ts suggested that gamma ray
affected by depth, it gives some indication of lithology peaks in shale sequences represent condensed sections,
and is simple (Figure 7.26). Moreover, it is almost always (maximum flooding surfaces in sequence stratigraphic
run and the sensitivity scales are always relatively similar. parlance) which are effective time lines and should be
Generally, because it is used for correlation, it is repro- correlated. This subject is considered in detail later in the
duced on the well completion log, the document used to book (Chapter 15) and in more detail in terms of the
reassemble the essential drilling and geological data at gamma ray below (Section 7.10).
the end of a well (see Chapter 11). In sandstones, gamma ray log shapes are often used to
Besides its availability, the gamma ray log has inherent correlate. However, the shape is a facies characteristic