
Page 91 - The Geological Interpretation of Well Logs
P. 91
- THE GAMMA RAY AND SPECTRAL GAMMA RAY LOGS -
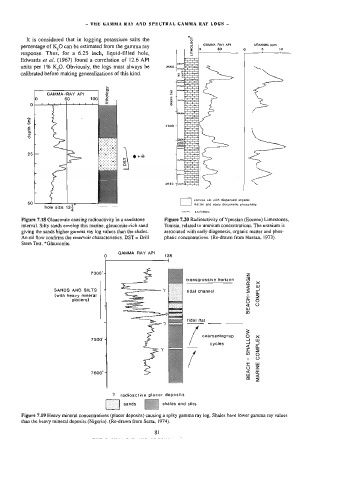
It is considered that in logging potassium salts the
percentage of K,O can be estimated from the gamma ray LITHOLOGY GAMMA RAY API URANIUM ppm
60
response. Thus, for a 6.25 inch, liquid-filled hole,
Edwards et al. (1967) found a correlation of 12.6 API
units per 1% K,O. Obviously, the logs must always be 2560
calibrated before making generalizations of this kind.
lithology
GAMMA-RAY API
o 50 106 5 3 Ne ped
2
0 J, A. 1 1 1 1 s
3 Same, .
—
(m)
2600
depth
2640
50 yadose silt with dispersed organic
mater and early diagenetic phosphate
° 1”
hole size 125
aww SH yfolilas
Figure 7.18 Glauconite causing radioactivity in a sandstone Figure 7.20 Radioactivity of Ypresian (Eocene) Limestones,
interval. Silty sands envelop this marine, glauconite-cich sand Tunisia, related to uranium concentrations. The uranium is
giving the sands higher gamma ray log values than the shales. associated with early diagenesis, organic matter and phos-
An oil flow confinns the reservoir characteristics. DST = Drill phatic concentrations. (Re-drawn from Hassan, 1973).
Stem Test, *Glauconite.
GAMMA RAY API
7300’ + z
transgressive horizon og
"—' c x
<4
SANDS AND SILTS tidal channel = a
(with heavy mineral
=
placers) 5 5
gq O
Ww
mo
tidal flat
. =
coarsening-up Oo x
7500°
cycles Z
a4 a
”o 1 9
xm ow
©
oz
xt
7600’ 4 wo &
o
=
Y radioactive placer deposits
shales and silts
Figure 7.19 Heavy mineral concentrations (placer deposits) causing a spiky gamma ray log. Shales have lower gamma ray values
than the heavy mineral deposits (Nigeria). (Re-drawn from Serra, 1974).