
Page 88 - The Geological Interpretation of Well Logs
P. 88
- THE GEOLOGICAL INTERPRETATION OF WELL LOGS -
To summarise: as shale indicators, thorium, may be the maximum average gamma ray log value to be pure
used in most cases, potassium may be used in many cases 100% shale (i.e., shale line, Figure 7.14), and the lowest
but uranium should not be used at al]. This obviously value to indicate no shale at all (i.e., sand line, Figure
has implications for the simple gamma ray log: it is not 7.14), a scale from 0 — 100% shale can be constructed. If
necessarily a good ‘shale indicator’. the scale is considered to be linear, any value (GR) of the
gamma ray log will give the volume of shale from the
7.7 Quantitative use of the simple calculation
simple gamma ray log
GR value (log) — GR (min)
volume of shale % =
The gamma ray log may often be used quantitatively, and * GR (max) —GR (min) ()
although the gamma ray value for shales varies enor-
mously, in any one area or well, the values for pure shale GR (max) = 100% shale, GR (min) = 0% shale, i.e. clean
tend to be constant (Figure 7.14). Thus, if 6ne considers formation.
>»
o Generally the value is not very accurate and tends to give
oO
_ an upper limit to the volume of shale (Vsh or Vclay).
D.CAL GAMMA RAY 2
Moreover, there is no scientific basis for assuming that
inches API E
the relationship between gamma ray value and shale
3
L
L
50
L
L
|
20 109-10
"99
4
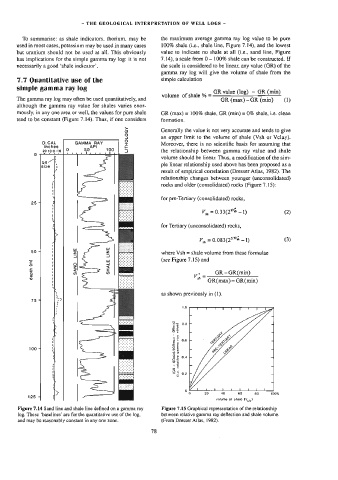
' volume should be linear. Thus, a modification of the sim-
4
pit“T ple linear relationship used above has been proposed as a
$1ze 1
é result of empirical correlation (Dresser Atlas, 1982). The
;
relationship changes between younger (unconsolidated)
{ rocks and older (consolidated) rocks (Figure 7.15):
4
1
N
for pre-Tertiary (consolidated) rocks,
267 J
#
—
1)
‘ Vy, = 0.33(2% (2)
i
LL,
NJ
4 for Tertiary (unconsolidated) rocks,
a
‘>
ti
is 1 V,,, = 0,083(2""* - t) (3)
'
Ww
50 4 1 uy z
where Vsh = shale volume from these formulae
4 ~ (see Figure 7.15) and
= g oO 7
we r 2 =x
£ < 5
a ' ” a yt ~ _GR-GR(min)
o 1
oo r
t * GR(max)-GR(min)
t]
“Sy
h, as shown previously in (1).
\
Ly
75 4 co
‘
1,0 T T T T T T T
; T T
“
ARmin) value) ° 2 T l
‘
- ORmin)/(GRmax ray gamma ° o T t » Sp,
125 + 4 iy EL 5 L qj F q q ? - (GR relative Uo. ° 2 cs ie T ( 1 !
t
(
100 5
i
q
volume of shale (¥_,,) 100%
Figure 7.14 Sand line and shale line defined on a gamma ray Figure 7.15 Graphical representation of the relationship
log. These ‘baselines’ are for the quantitative use of the log, between relative gamma ray deflection and shale volume.
and may be reasonably constant in any one zone. (From Dresser Atlas, 1982).
78