
Page 87 - The Geological Interpretation of Well Logs
P. 87
- THE GAMMA RAY AND SPECTRAL GAMMA RAY LOGS -
Table 7.13 Thorium abundance in clay minerals. Fable 7.14 Average radioactive mineral content and contribu-
(From Hassan et al., 1976; Dresser Atlas, 1983). lion to total shale radioactivity (this is only one set of figures
among several),
Thorium ppm
Mineral (approximate average) ‘Average ‘Range *contribution
content to total
radioactivity %
Bauxite 8-132 (42) More continental
Kaolinite 18-26
Uranium = 4 ppm 2ppm-6ppm 29%
lilite-muscovite 6-22
Thorium 12 ppm Sppm-18ppm 42%
Smectite 10-24
Potassium 2.0% 2.0% - 3.5% 29%
Glauconite 2-8 More marine
‘Myers, K. pers. comm.
the clay-grain sized fraction, thorium shows an affinity *using the average figures (column 2)
for terrestrial clay minerals. For example, it shows higher
concentrations in kaolinites (of terrestrial origin) than the relative contribution of each element to the overall
in glauconites (of marine origin) (Hassan et al., 1976; radioactivity (Table 7.14).
Figure 7.1, Table 7.13). In the coarse grained sediments, But the gamma ray log should not be used as a ‘black
thorium minerals may be found as silt-sized heavy min- box’ shale indicator either qualitatively or quantitatively,
eral concentrations or placer deposits (see ‘sandstone as is commonly the case. The behaviour of the individual
radioactivity’ below). tadioactive elements in clay minerals and clays in general
Despite its lack of solubility, thorium is however, is so different, as the preceding geochemical descriptions
widely and relatively evenly distributed in sediments. So indicate, that there is a need for more detailed under-
much so that in shales it is used as a base level from standing.
which the relative abundance of the other radioactive Potassium is involved in the chemical make up of clay
elements, especially uranium, is measured (Section 7.10). mineral structure and, despite the variations of this in
specific clay mineral species (Table 7.8), has a fairly con-
7.6 Radioactivity of shales and clays sistent content in most shales, of around 2% — 3.5%. This
is the case since shales are generally a mix of several of
In petroleum borehole logging the commonest natural
the clay mineral types. Potassium therefore is a moder-
radioactivity (by volume) is found in shales (clays). A
ately good ‘shale indicator’. However, potassium occurs
high gamma ray value frequently means shale. A typical
in detrital minerals such as feldspars as well as in clay
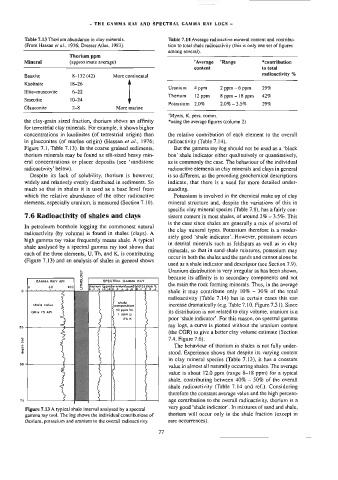
shale analysed by a spectral gamma ray tool shows that
minerals, so that in sand-shale mixtures, potassium may
each of the three elements, U, Th, and K, is contributing
occur in both the shales and the sands and cannot alone be
(Figure 7.13) and an analysis of shales in general shows
used as a shale indicator and descriptor (see Section 7.9).
» Uranium distribution is very irregular as has been shown,
oO
%
because its affinity is to secondary components and not
GAMMA RAY API 2 SPECTRAL GAMMA RAY
the main the rock forming minerals. Thus, in the average
1 © fthorium (pomjuranium{pom)|potasslum %
o. yt 3 at os — io 4 Belo 2 ss gb ae O11 2 3 4
shale it may contribute only 10% - 30% of the total
radioactivity (Table 7.14) but in certain cases this can
shale
shale valus composition increase dramatically (e.g. Table 7.10, Figure 7.31). Since
GR= 75 Apt 10 pom Ta. its distribution is not related to clay volume, uranium is a
i ppm VU,
2% K poor ‘shale indicator’. For this reason, on spectral gamma
a ray logs, a curve is plotted without the uranium content
(the CGR) to give a better clay volume estimate (Section
(m) 7.4, Figure 7.6).
depth stood. Experience shows that despite its varying content
The behaviour of thorium in shales is not fully under-
in clay mineral species (Table 7.13), it has a constant
Qa 2
value in almost all naturally occurring shales. The average
shale, contributing between 40% — 50% of the overall
value is about 12.0 ppm (range 8-18 ppm) for a typical
shale radioactivity (Table 7.14 and ref.). Considering
age contribution to the overall radioactivity, thorium is a
75 therefore the constant average value and the high percent-
very good ‘shale indicator’. In mixtures of sand and shale,
Figure 7.13 A typical shale interval analysed by a spectral
gamma ray tool. The log shows the individual contributions of thorium will occur only in the shale fraction (except in
thorium, potassium and uranium to the overail radioactivity. rare occurrences).
77