
Page 93 - The Geological Interpretation of Well Logs
P. 93
- THE GAMMA RAY AND SPECTRAL GAMMA RAY LOGS -
»~
> 9
ag S
o GAMMA RAY AP]
So
0 30 60 90 120 150] &
3 @ so Sea 18 0 a
BS {in.)
5
4
4
4
1
i
4
L
i
4
1
e = od «ié-.__J CALI in oe 18
# 8 &
8 o 5
GR (API)
1
L
_}
4
i
L
1
1
Co SILL
Z aN composition basic,
i.e. pyroxene and
=a
Vy 25 plagioclase
ys
J - Sm
fe
i
4
iY
(
4 - 410m
) 60
4 N
z£
N -1Sm E
N &
N a 3
S
N Fr 20m 7§
NI organic shala
N
N
N
N 400
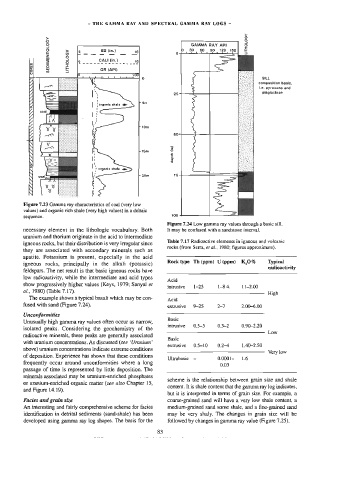
Figure 7.23 Gamma ray characteristics of coal (very low
values) and organic rich shale (very high values) in a deleaic
sequence.
Figure 7.24 Low gamma ray values through a basic sill.
necessary element in the Hthologic vocabulary. Both It may be confused with a sandstone interval.
uranjum and thorium onginate in the acid to intermediate
Table 7.17 Radioactive elements in igneous and volcanic
igneous rocks, but their distribution is very irregular since
rocks (from Serra, et a/., 1980; figures approximate).
they are associated with secondary minerals such as
apatite. Potassium is present, especially in the acid
Rock type Thi(ppm) U(ppm) K,0% Typical
igneous rocks, principally in the alkali (potassic)
radioactivity
feldspars. The net result is that basic igneous rocks have
low radioactivity, while the intermediate and acid types
Acid
show progressively higher values (Keys, 1979; Sanyal et
intrusive 1-25 1-8 4. 11-2.00
ail., 1980) (Table 7.17).
High
The example shows a typical basalt which may be con-
Acid
fused with sand (Figure 7.24).
extrusive 9-25 2-7 2,00-6.00
Unconformities
Basic
Unusually high gamma ray values often occur as narrow,
intrusive 0.5-5 0.3~2 0.90-2.20
isolated peaks. Considering the geochemistry of the
Low
radioactive minerals, these peaks are generally associated
Basic
with uranium concentrations. As discussed (see ‘Uranium’
extrusive 05-10 0.2-4 1.40-2.50
above) uranium concentrations indicate extreme conditions
Very low
of deposition. Experience has shown that these conditions
Ultwabasic - 0.0001- 1.6
frequently occur around unconformities where a long
0.03
passage of time is represented by littke deposition. The
minerals associated may be uranium-enriched phosphates
scheme is the relationship between grain size and shale
or uranium-enriched organic matter (see also Chapter 15,
content. It is shale content that the gamma ray log indicates,
and Figure 14.19),
but it is interpreted in terms of grain size. For example, a
Facies and grain size coarse-grained sand will have a very low shale content, a
An interesting and fairly comprehensive scheme for facies medium-grained sand some shale, and a fine-grained sand
identification in detrital sediments (sand-shale} has been may be very shaly. The changes in grain size will be
developed. using gamma ray log shapes. The basis for the followed by changes in gamma ray value (Figure 7.25).
83