
Page 95 - The Geological Interpretation of Well Logs
P. 95
- THE GAMMA RAY AND SPECTRAL GAMMA RAY LOGS -
SSE
BN-7 BN-5
a
SW BN-I4 BN-I7 BN-10.—BN=6—BN-IN_
a,
NE
= mS
=
So
50
=
€
SCALE
a
<=,
00 eer
= = z
_ i:
200
LOGS CORRECTED TO TVO
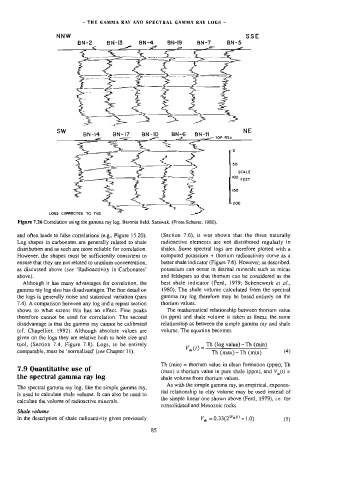
Figure 7.26 Correlation using the gamma ray log. Baronia field, Sarawak. (From Scherer, 1980).
and often leads to false correlations (e.g., Figure 15.20). (Section 7.6), it was shown that the three naturally
Log shapes in carbonates are generally related to shale radioactive elements are not distributed regularly in
distribution and as such are more reliable for correlation. shales. Some spectral logs are therefore plotted with a
However, the shapes must be sufficiently consistent to computed potassium + thorium radioactivity curve as a
ensure that they are not related to uranium concentration, better shale indicator (Figure 7.6). However, as described,
as discussed above (see ‘Radioactivity in Carbonates’ potassium can occur in detrital minerals such as micas
above). and feldspars so that thorium can be considered as the
Although it has many advantages for correlation, the best shale indicator (Fertl, 1979; Schenewerk e¢ ail.,
gamma ray log also has disadvantages. The fine detai] on 1980). The shale volume calculated from the spectral
the logs is generally noise and statistical variation (para gamma ray tog therefore may be based entirely on the
7.4). A comparison between any log and a repeat section thorium values.
shows to what extent this has an effect. Fine peaks The mathematical relationship between thorium value
therefore cannot be used for correlation. The second (in ppm) and shale volume is taken as linear, the same
disadvantage is that the gamma ray cannot be calibrated relationship as between the simple gamma ray and shale
(cf. Chapellier, 1992). Although absolute values are volume. The equation becomes
given on the logs they are relative both to hole size and
tool, (Section 7.4, Figure 7.8). Logs, to be entirely Th (log value) - Th (min)
comparable, must be ‘normalized’ (see Chapter 11). PaO = Snax) (min) (4)
—
Th
Th (min) = thorium value in clean formation (ppm); Th
7.9 Quantitative use of
(max) = thorium value in pure shale (ppm), and V(t) =
the spectral gamma ray log shale volume from thorium values.
As with the simple gamma ray, an empirical, exponen-
The spectral gamma ray log, like the simple gamma ray,
tial relationship to clay volume may be used instead of
is used to calculate shale volume. It can also be used to
the simple linear one shown above (Fertl, 1979), i.e. for
calculate the volume of radioactive minerals.
consolidated and Mesozoic rocks
Shale volume
In the description of shale radioactivity given previously 85 Vy = 0.33(277 — 1.0) (5)