
Page 99 - The Geological Interpretation of Well Logs
P. 99
- THE GAMMA RAY AND SPECTRAL GAMMA RAY LOGS -
MARINE CONTINENTAL | ENVIRONMENT
sandsiones
avarags
shaig
v is LITHOLOGY
3 o a wo | $ & 3 2g g
7 |2 2 | @ ¢€ gs
s 3s 2 2 » a2Gn) nv 284
2 a 4 5 ¥ 2 E412 2 «x8
“ls 2 &B se aS §F 33
6 = e353 % é a * oo a0
i .
TTF
ppm thorwm
g|'°* 6 1016 20 ppm high
a 2 “iy
a €
Igneous rock source
?
2
5
low gn Th/Y ratio
246
< uranium increases
a
y
23
thorium increases
Fe
3
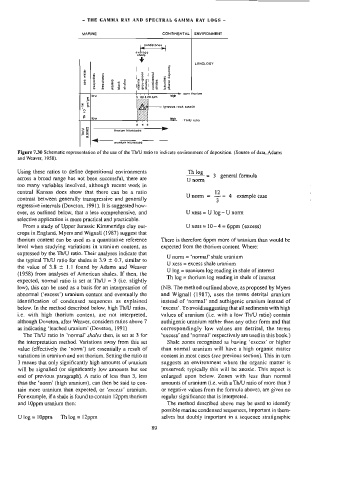
Figure 7.30 Schematic representation of the use of the Th/U ratio to indicate environment of deposition. (Source of data, Adams
and Weaver, 1958).
Using these ratios to define depositional environments
Thlog _ 3 general formula
across a broad range has not been successful, there are
U norm
too many variables involved, although recent work in
central Kansas does show that there can be a ratio 12
Unorm = 37 4 example case
contrast between generally transgressive and generally
regressive intervals (Doveton, 1991). It is suggested how-
ever, as outlined below, that a jess comprehensive, and U xess = U log—- U norm
selective application is more practical and practicable.
From a study of Upper Jurassic Kimmeridge clay out- U xess = 10-4 = 6ppm (excess)
crops in England, Myers and Wignall (1987) suggest that
thorium content can be used as a quantitative reference There is therefore 6ppm more of uranium than would be
level when studying vanations in uranium content, as expected from the thorium content. Where:
expressed by the Th/U ratio. Their analyses indicate that
U norm = ‘norma’ shale uranium
the typical Th/U ratio for shales is 3.9 + 0.7, similar to
U xess = excess shale uranium
the value of 3.8 + 1.1 found by Adams and Weaver
U log = uranium log reading in shale of interest
(1958) from analyses of American shales. If then, the
Th log = thorium log reading in shale of interest
expected, normal ratio is set at Th/U = 3 (ie. slightly
low), this can be used as a basis for an interpretation of (NB. The method outlined above, as proposed by Myers
abnormal (‘excess’) uranium content and eventually the and Wignall (1987), uses the terms detrital uranium
identification of condensed sequences as explained instead of ‘normal’ and authigenic uranium instead of
below. In the method described below, high Th/U ratios, ‘excess’. To avoid suggesting that all sediments with high
i.e. with high thorium content, are not interpreted, values of uranium (i.e. with a low Th/U ratio) contain
although Doveton, after Weaver, considers ratios above 7 authigenic uranium rather than any other form and that
as indicating ‘leached uranium’ (Doveton, 1991) correspondingly low values are detrital, the terms
The Th/U ratio in ‘normal’ shales then, is set at 3 for ‘excess’ and ‘normal’ respectively are used in this book.)
the interpretation method. Variations away from this set Shale zones recognized as having ‘excess’ or higher
value (effectively the ‘norm’) are essentially a result of than normal uranium will have a high organic matter
variations in uranium and not thorium. Setting the ratio at content in most cases (see previous section). This in turn
3 means that only significantly high amounts of uranium Suggests an environment where the organic matter is
will be signalled (or significantly low amounts but see preserved; typically this will be anoxic. This aspect is
end of previous paragraph). A ratio of less than 3, less enlarged upon belaw. Zones with less than normal
than the ‘norm’ (high uranium), can then be said to con- amounts of uranium (i.e. with a Th/U ratio of more than 3
tain more uranium than expected, or ‘excess’ uranium. or negative values from the formula above), are given no
For example, if a shale is found to contain |2ppm thorium regular significance that is interpreted.
and !Oppm uranium then: The method described above may be used to identify
possible marine condensed sequences, important in them-
Ulog=10ppm Th log = 12ppm selves but doubly important in a sequence stratigraphic
89