
Page 140 - The Geological Interpretation of Well Logs
P. 140
- THE GEOLOGICAL INTERPRETATION OF WELL LOGS -
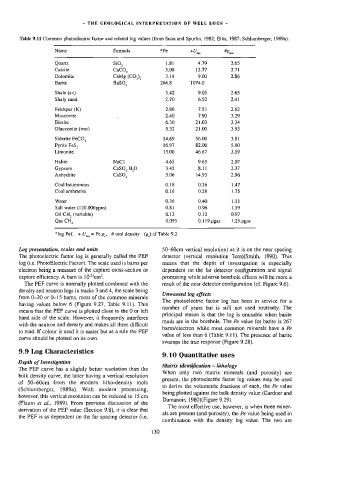
Table 9.11 Common photoelectric factor and related log values (from Suau and Spurlin, 1982; Ellis, 1987; Schlumberger, 1989a).
Name Formula *Pe +U., #0 na
Quartz SiO, 1.81 4.79 2.65
Calcite Caco, 5.08 13.77 2.7)
Dolomite CaMg (CO,), 3.14 9.00 2.86
Barite BaSO, 266.8 1074.0
Shale (av) 3.42 9.05 2.65
Shaly sand 2.70 6.52 2.4)
Feldspar (K) 2.86 751 2.62
Muscovite 2.40 7.90 3.29
Biotite 6.30 21.03 3.34
Glauconite (wet) §.32 21.00 3.95
Siderite FeCO, 14.69 56.00 3.8)
Pyrite FeS, 16.97 82.00 5.00
Limonite 13.00 46.67 3.59
Halite NaCl 4.65 9.65 2.07
Gypsum CaSO,.H,O 3.42 8.1) 2.37
Anhydrite CaSO, 5.06 14.95 2.96
Coal bituminous 0.18 0.26 1.47
Coal anthracite 0.16 0.28 1.75
Water 0.36 0.40 1.1)
Salt water (120.000ppm) 0.81 0.96 1.19
Oil CH, (variable) 0.13 0.12 0.97
Gas CH, 0.095 0.119.pgas 1,25.pgas
*log Pef, +U_,=Pe.p,, # tool density (p,) cf Table 9.2
Log presentation, scales and units 50-60cm vertica] resolution) as it is on the near spacing
The photoelectric factor log is generally called the PEF detector (vertical resolution 7cm)(Smith, 1990). This
log (i.e. PhotoElectric Factor). The scale used is barns per means that the depth of investigation is especially
electron being a measure of the capture cross-section or dependent on the far detector configuration and signal
capture efficiency. A barn is 104cem?. processing while adverse borehole effects will be more a
The PEF curve is normally plotted combined with the result of the near detector configuration (cf. Figure 9.6).
density and neutron logs in tracks 3 and 4, the scale being
Unwanted log effects
from 0-20 or 0-15 barns, most of the common minerals
The photoelectric factor log has been in service for a
having values below 6 (Figure 9.27, Table 9.11). This
number of years but is still not used routinely. The
means that the PEF curve is plotted close to the 0 or left
principal reason is that the log is unusable when barite
hand side of the scale. However, it frequently interferes
muds are in the borehole. The Fe value for barite is 267
with the neutron and density and makes all three difficult
bams/electron while most common minerals have a Pe
to read. If colour is used it is easier but as a rule the PEF
value of less than 6 (Table 9.11). The presence of barite
curve should be plotted on its own.
swamps the true response (Figure 9.28).
9.9 Log Characteristics
9.10 Quantitative uses
Depth of Investigation
Matrix identification — lithology
The PEF curve has a slightly better resolution than the
When only two matrix minerals (and porosity) are
bulk density curve, the latter having a vertical resolution
present, the photoelectric factor log values may be used
of 50-60cm from the modern litho-density tools
to derive the volumetric fractions of each, the Pe value
(Schlumberger, 1989a). With modern processing,
being plotted against the bulk density value (Gardner and
however, this vertical resolution can be reduced to 15 cm
Dumanoir, 1980)(Figure 9.29).
(Flaum et ai., 1989). From previous discussion of the
The most effective use, however, is when three miner-
derivation of the PEF value (Section 9.8), it is clear that
als are present (and porosity), the Pe value being used in
the PEF is as dependent on the far spacing detector (i.e.
combination with the density log value. The two are
130