Page 135 - The Geological Interpretation of Well Logs
P. 135

-  THE  DENSITY  AND  PHOTOELECTRIC  FACTOR  LOGS  -

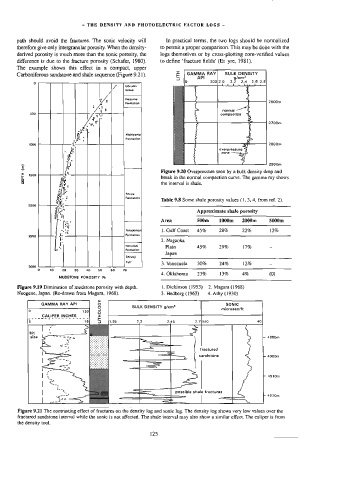
       path  should  avoid  the  fractures.  The  sonic  velocity  will   In  practical  terms,  the  two  logs  should  be  normalized
       therefore  give  only  intergranular  porosity.  When  the  density-   to  permit  a  proper  comparison.  This  may  be  done  with  the
       derived  porosity  is  much  more  than  the  sonic  porosity,  the   logs  themselves  or  by  cross-plotting  core-verified  values
       difference  is  due  to  the  fracture  porosity  (Schafer,  1980).   to  define  ‘fracture  fields’  (Et  yre,  1981).
       The  example  shows  this  effect  in  a  compact,  upper

       Carboniferous  sandstone  and  shale  sequence  (Figure  9.21),   =  | GAMMA  RAY|   BULK  DENSITY
                                                               5      API          gicm
                                                                  °        200  2.9   2.2   24,   2.6  2.8)
             Qo
                                        |  /   Uonuma
                                       A     Group

                                    VA       Haizume  -
                                                                     2600m
                                    :        Formation
                                    At
                                  Ls                                           oormal  a"
           500                                                                compaction
                                   a
                            -    a  "i
                                                                     2700m
                              i
                             “  oe
                            a   °            Nishiyama
                           if   .            Formation
                          ik
           1000                                                      2800m
                                                                              overpressure
                                                                               Tone  ee,

                                                                                   2900m
        =  z            i   i
         =   1800       a‘                                Figure  9.20  Overpressure  seen  by  a  bulk  density  drop  and

        a             g                                   break  in  the  normal  compaction  curve.  The  gamma  ray  shows
                      uu,                                 the  interval  is  shale.
                      >»
                     sf sha"                 Shiiya
                     x o?                    Formation
                                                         Table  9.8  Some  shale  porosity  values  (1,  3,  4,  from  ref.  2).
                     a
           2000
                     “Kt.

                    i                                                 Approximate  shale  porosity
                    gtk
                                                         Area         500m    1000m   2000m    5000m
                       hs
                        “ye
                       ~  ‘t                 Teradomari   1.  Guif  Coast   45%   28%   22%     13%
                                                                 Plain   45%   29%    17%       -
                                             ®
                      t
           2500
                                                          2.  Nagaoka
                                             Nanalani
                      I
                                             Formation
                     2°                                    Japan
                                             Shiva}
                                                                              24%
                                                                                      12%
                                                          3.  Venezuela
                                                                      30%
                                                                                                -
           3000                              Tult

              °    10   20   30   40   50   60   76
                                                         4.  Oklahoma   23%   13%     4%        (0)
                      MUDSTONE  POROSITY  %

       Figure  9.19  Diminution  of  mudstone  porosity  with  depth.   |.  Dickinson  (1953)   2.  Magara  (1968)
       Neogene,  Japan.  (Re-drawn  from  Magara,  1968).   3.  Hedberg  (1963)   4.  Athy  (1930)
                                    GY
                GAMMA  RAY  API                 BULK  DENSITY  g/cm?           microsec/ft
                                                                                SONIC
                                    LITHOLO
                CALIPER  INCHES                  2,2
                                                                                               4880m
                                                                       fractured
                                                                       sandstone               4900m
                                                                                               4910m
                                                               possible  shale  fractures
                                                                                               4920m
       Figure  9.21  The  contrasting  effect  of  fractures  on  the  density  log  and  sonic  log.  The  density  log  shows  very  low  values  over  the
       fractured  sandstone  interval  while  the  sonic  is  not  affected.  The  shale  interval  may  also  show  a  similar  effect.  The  caliper  is  from
       the  density  tool.
                                                      125
   130   131   132   133   134   135   136   137   138   139   140