
Page 139 - The Geological Interpretation of Well Logs
P. 139
- THE DENSITY AND PHOTOELECTRIC FACTOR LOGS -
9.8 Principles of Measurement factor are measured (Section 9.3). The photoelectric factor
Pe, plotted on the log, is based on corrected counting rates
When gamma rays pass through matter, at most energies
in the low energy area, principally from the far detector.
they degrade through collision or Compton scattering
In reality, the count rate in the low energy area is a
(para 9.2). In addition, at low energies, below about 100
combined result of the electron density effect of Compton
keV, the phenomenon known as photoelectric absorption
scattering and the photoelectric absorption effect of the
takes effect. Photoelectric absorption occurs when
formation. That is, in the low energy area a quantity
gamma rays have lost sufficient energy to be captured and
called U (photoelectric absorption cross section per unit
absorbed by electrons electrically bound to atoms. The
volume) is registered which is the product of the electron
capturing electron acquires energy, leaves its atomic orbit
density, p, and the photoelectne factor, Pe (Gardner &
and becomes ionised (Figure 9.3). The degree of absorp-
Dumanoir 1980). Pe, the photoelectric factor, is therefore
tion depends on both the atomic number (Z) and the
the ratio of the two:-
electron density (p,) of the atoms, effectively their atomic
complexity. Ln geological terms, this is related to chemical
Pe= u
composition and indirectly to lithology.
Pe
A Pe measurement is made by most of the modern
Where:
generation of density tools, the LDT or litho-density of
U = photoelectric absorption cross section, per unit
Schlumberger, the Z-Density of Western Atlas and the
volume (low energy window count of tool),
Photo Density of BPB. These tools are similar to the two
p, = electron density index, per unit volume (high
detector density tools described previously (Section 9.2)
energy window count), and
in that they have a high energy gamma ray source, gen-
Pe = photoelectric absorption factor, per unit weight.
erally of 662keV, and a near and far detector. However,
the modern tools have more efficient scintillation detec-
This means in effect that Pe, the photoelectric factor plot-
tors with more complex energy gates which detect both
ted as the log, is derived by stripping the electron density
high (hard) and low (soft) gamma radiations. Thus, the
effect of the high energy window from the overall effect
detectors register counts in both the high energy area,
in the low energy window (Figure 9.3).
dominated by Compton scattering, and the low energy area
It is worth noting that p, is in electrons/cm’, Pe is in
where the photoelectric effect is important (Figure 9.3).
barns/electron and U is in barns/cm’, the effective photo-
Both an improved energy value and a photoelectric
electric absorption cross section index per unit volume.
spectral gamma ray photoclectric absorption
bit size APL units factor or Pe cable tension lbs
X, L
\sonigaey) | ff Ye TENS {LEF) |
0.0 150.00 6000.0 1900.0
BS {IN} PEF
6.0000 16.000 0.0 16.600
woe--- CALLAIN) od. [~ units = barns/electron
6.0000 16.000
: caliper
th | | '
‘ < Pe log reading
I; 3-7] § barns/electron ?
i _ GR rd 2
}\ 2 5
Ti q i
K 2 ey 4
. - cable tension”
? about 2500lbs {
)
5
>
t
7
¢|
4
J 5
<
% \
¢
i
f Q
¢
p ‘ ¢
5
L/
1
¢
~N
\
?
5
4
§
é
,
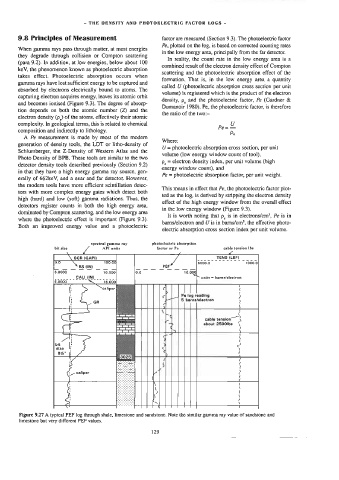
Figure 9.27 A typical PEF log through shale, limestone and sandstone. Note the similar gamma ray value of sandstone and
limestone but very different PEF values.
129