
Page 136 - The Geological Interpretation of Well Logs
P. 136
- THE GEOLOGICAL INTERPRETATION OF WELL LOGS -
>
8
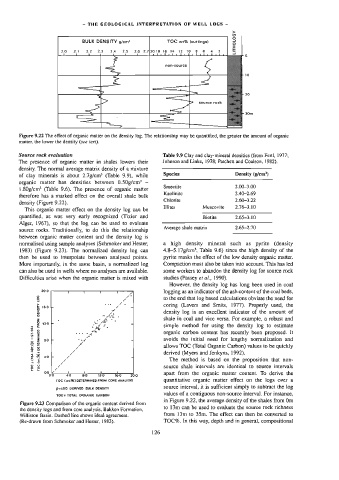
BULK DENSITY g/cm? TOC wt% (cuttings) a
Ps
2.0 2.1 2.2 2.3 2.4 2.5 2.6 2,.7/2018 16 14 12 tO 8 6 4 2 FE
1 l 1 L n J pe —_ 0
non-source c
| = _, °
"2 —=T* 20
> [~ source rock
Figure 9.22 The effect of organic matter on the density log. The reJationship may be quantified, the greater the amount of organic
matter, the lower the density (see text).
Source rock evaluation Table 9.9 Clay and clay-mineral densities (from Fert], 1977;
The presence of organic matter in shales lowers their Johnson and Linke, 1978; Patchett and Coalson, 1982).
density. The norma] average matrix density of a mixture
of clay minerals is about 2.7g/em? (Table 9.9), while Species Density (g/cm?)
organic matter has densities between 0.50g/cm? —-
Smectite 2.00-3.00
\.80g/cm? (Table 9.6). The presence of organic matter
Kaolinite 2.40-2.69
therefore has a marked effect on the overall shale bulk
Chlorite 2.60—3.22
density (Figure 9.22),
Tllites Muscovite 2.76-3.10
This organic matter effect on the density log can be
quantified, as was very early recognized (Tixier and Biotite 2.65-3.10
Alger, 1967), so that the log can be used to evaluate
Average shale matrix 2.65-2.70
source rocks. Traditionally, to do this the relationship
between organic matter content and the density log is
normalised using sample analyses (Schmoker and Hester, a high density mineral such as pyrite (density
1983) (Figure 9.23). The normalized density log can 4.8-5.17g/cm*, Table 9.6) since the high density of the
then be used to interpolate between analysed points. pyrite masks the effect of the low density organic matter.
More importantly, in the same basin, a normalized log Compaction must also be taken into account. This has led
can also be used in wells where no analyses are available. some workers to abandon the density Jog for source rock
Difficulties arise when the organic matter is mixed with studies (Passey et al., 1990).
However, the density log has long been used in coal
1
1
1
20-0 logging as an indicator of the ash content of the coal beds,
:
8 c to the end that log based calculations obviate the need for
g Yo
coring (Lavers and Smits, 1977). Properly used, the
E eob yd
z 7 density log is an excellent indicator of the amount of
w fe
o fa 8 shale in coal and vice versa. For example, a robust and
= ot he
S y290h "5
S 120 nS 4
o wu * x . simple method for using the density log to estimate
x oO v1
x WwW . 7h organic carbon content has recently been proposed. It
wo 2 yr
2 sob ted avoids the intial need for lengthy normalization and
-— «£ 7
S¢ / allows TOC (Total Organic Carbon) values to be quickly
7° L derived (Myers and Jenkyns, 1992).
BR aol 7 4
TE 74 The method is based on the proposition that non-
8 8 ¢ source shale intervals are identical to source intervals
- 7
oO n 1 L 1
apart from the organic matter content. To derive the
oo 40 8-0 720 160 20-0
TOS (wi.%) DETERMINED FROM CORE ANALYSIS quantitative organic matter effect on the logs over a
P=LOG DERIVED BULK DENSITY source interval, it is sufficient simply to subtract the log
TOC TOTAL ORGANIC CARBON values of a contiguous non-source interval. For instance,
=
in Figure 9.22, the average density of the shales from Om
Figure 9.23 Comparison of the organic content derived from
to 13m can be used to evaluate the source rock richness
the density logs and from core analysis, Bakken Formation,
Williston Basin. Dashed line shows ideal agreement. from 13m to 35m. The effect can then be converted to
(Re-drawn from Schmoker and Hester, 1983). TOC%. In this way, depth and in general, compositional]
126